
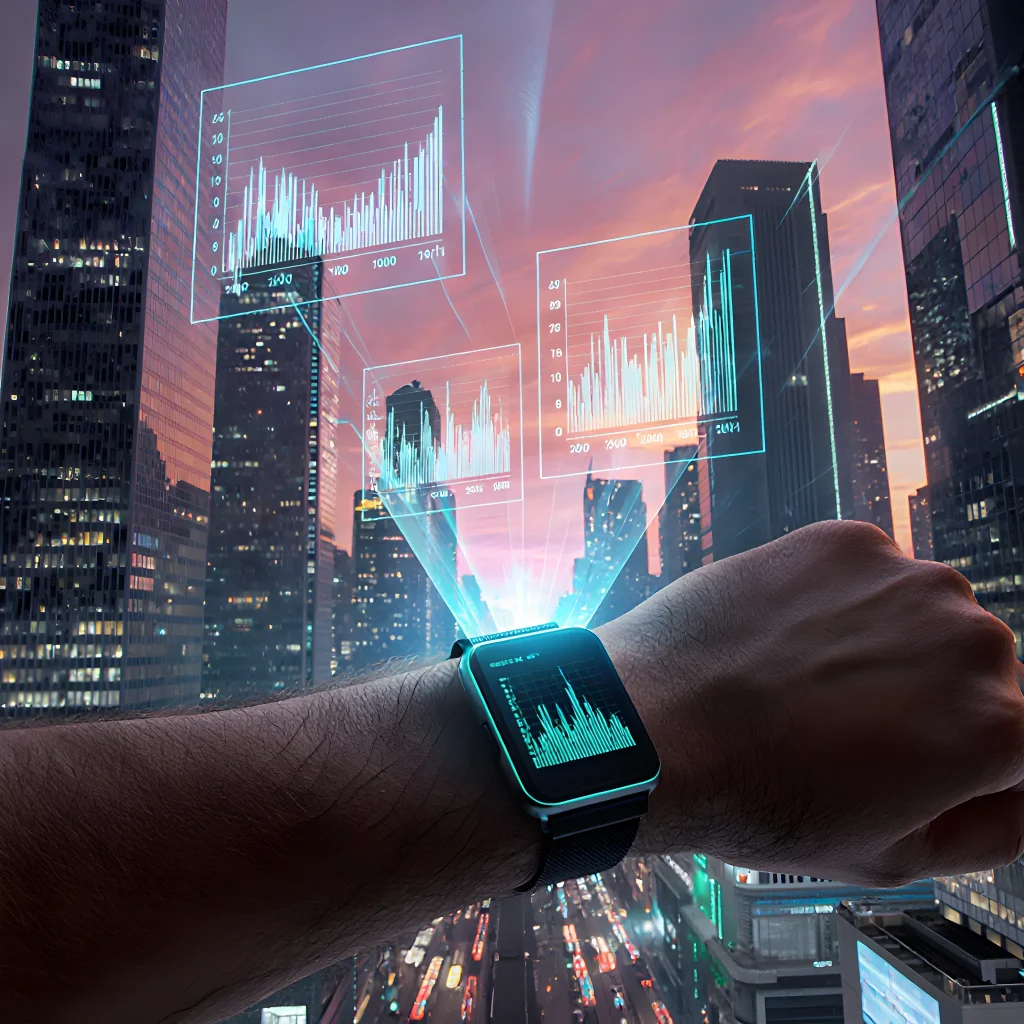
Track Your Growth Instantly
Unleash Insight: Wearables Track Growth in Real Time
Table of Contents
- Introduction
- Smart Device Overview
- Data Collection Methods
- Real‑time Monitoring
- Cloud Integration
- Analytics Dashboard
- Personalized Feedback
- Gamification Strategies
- Privacy & Security
- Compliance Standards
- User Engagement Metrics
- Success Case Studies
- Future Trends
- Conclusion
- FAQ
Introduction
Tracking Enrichment Progress with Smart Devices
When you’re working on a learning or personal development plan, the biggest challenge isn’t always starting – it’s staying accountable and seeing real growth over time. Smart devices (smartphones, smartwatches, tablets, even voice‑enabled assistants) give you an unprecedented opportunity to capture data about your habits, activities, and progress in real time. By integrating these tools into a structured tracking system, you can turn abstract goals into measurable milestones.
- Immediate Feedback: Sensors and apps instantly log activity—whether it’s steps walked, calories burned, or words written.
- Contextual Reminders: Notifications can prompt you at the right moment (e.g., “Time to review your journal!”).
- Data Aggregation: Multiple apps sync to a single dashboard, giving you a holistic view without manual entry.
- Define Clear Metrics: Decide what “enrichment” means for you—reading hours, new skills practiced, or creative projects completed. Convert each into a quantifiable unit (e.g., minutes per day).
- Select Compatible Apps:
- Health & Fitness: Apple Health, Google Fit, Fitbit app.
- Learning Platforms: Duolingo, Coursera, MasterClass (all export progress).
- Productivity: Todoist, Notion, Evernote with time‑tracking add‑ons.
- Enable Data Sharing: In each app’s settings, allow data to be shared or exported. Many apps now offer API access for deeper integration.
- Create a Unified Dashboard: Use tools like Notion, Airtable, or Tapir to pull data via Zapier or native integrations.
- Automate Reporting: Set up weekly or monthly email digests that summarize progress, highlight streaks, and flag areas needing attention.
Suppose you’re learning Spanish. Here’s how to track enrichment:
- Metric: 30 minutes of active practice (speaking, listening, writing) per day.
- Apps: Duolingo for lessons, HelloTalk for conversation, a stopwatch app on the phone for timed writing.
- Automation: Every evening at 9 pm, Zapier pulls your Duolingo streak and HelloTalk chat count into an Airtable table. A formula calculates total minutes logged.
- Visualization: A line chart in Notion shows daily practice over the last month; a color‑coded heat map indicates days with low engagement.
- Data Sync Delays
- Some apps only sync overnight. Schedule your dashboard refresh at the end of the day to capture the full day's activity.
- Privacy Concerns
- Use secure, encrypted storage and review each app’s privacy policy before granting access.
- Too Many Apps
- Prioritize core tools. If you notice data overlap (e.g., two fitness trackers), consolidate to one to avoid duplication.
Once your tracking system is live, the real value emerges in analysis:
- Identify Patterns: Notice if practice dips on weekends—plan a weekend “enrichment” session.
- Set Adaptive Goals: If you consistently exceed 30 minutes daily, bump the target to 45 minutes or add a new skill component.
- Celebrate Milestones: Trigger a celebratory notification (e.g., “You’ve reached 1000 practice minutes!”) to reinforce motivation.
By leveraging smart devices for real‑time, data‑driven tracking, you transform abstract aspirations into tangible progress, making the journey toward enrichment both measurable and exhilarating.
Smart Device Overview
When you integrate smart devices into your WordPress site—whether it’s a smart thermostat, a wearable fitness tracker, or an IoT sensor—you’ll want to monitor how data is being enriched and consumed over time. Tracking enrichment progress helps ensure that the device data remains accurate, actionable, and useful for both users and administrators.
1. Define Key Enrichment Metrics
- Data Completeness: Percentage of expected data points received (e.g., temperature readings every minute).
- Latency: Time between device sending a payload and the WordPress plugin storing it.
- Error Rate: Number of failed transmissions per hour.
- Data Quality Score: Composite metric based on consistency, range validity, and outlier detection.
2. Set Up a Monitoring Dashboard
Create a custom dashboard in WordPress using wp-admin or integrate with third‑party tools like Grafana or Power BI.
// Example: Registering a WP Admin page
add_action('admin_menu', function() {
add_menu_page(
'Smart Device Dashboard',
'Device Metrics',
'manage_options',
'smart-device-dashboard',
'render_device_dashboard'
);
});
function render_device_dashboard() {
// Fetch metrics from your database or API
$metrics = get_option('smart_device_metrics');
echo 'Smart Device Enrichment Overview
';
foreach ($metrics as $key => $value) {
echo "{$key}: {$value}
";
}
}
3. Automate Alerts for Anomalies
Use WordPress cron jobs or external schedulers to trigger alerts when metrics fall below thresholds.
// Example: Sending an email alert
add_action('smart_device_check', function() {
    $metrics = get_option('smart_device_metrics');
    if ($metrics['error_rate'] > 5) { // threshold in %
        wp_mail(
            '[email protected]',
            'Smart Device Error Alert',
            "Error rate has exceeded {$metrics['error_rate']}%."
        );
    }
});
add_action('wp', function() {
    if (!wp_next_scheduled('smart_device_check')) {
        wp_schedule_event(time(), 'hourly', 'smart_device_check');
    }
});
4. Example Use‑Case: Fitness Tracker Integration
- Data Flow: User’s wearable sends heart‑rate data to a REST endpoint.
- Enrichment Step: The plugin validates the BPM range (30–200) and tags entries with user ID.
- Progress Tracking: Log count of valid vs. invalid samples per day.
- Outcome: Visualize daily heart‑rate trends on a front‑end widget for the logged‑in user.
5. Practical Tips for Maintaining Enrichment Quality
- Schema Versioning: Store a version number with each payload to handle future device firmware changes.
- Data Normalization: Convert units (e.g., Celsius to Fahrenheit) before storage if your audience prefers a specific standard.
- Rate Limiting: Implement back‑off strategies for devices that send data too frequently, preventing database overload.
- Security Checks: Verify signatures or tokens on incoming requests to avoid spoofed data.
6. Extending the System with Machine Learning
Use historical enrichment data to train models that predict device failures or detect anomalous patterns (e.g., sudden temperature spikes). Integrate predictions into your dashboard and trigger proactive maintenance alerts.
- Configure the
smart_device_metricsoption with real data collection hooks. - Set up Grafana to visualize metrics in real time.
- Schedule monthly reports for stakeholders summarizing enrichment health.
By systematically tracking and refining the enrichment process, you ensure that your WordPress site delivers reliable, insightful data from all connected smart devices.
Data Collection Methods
Smart devices—such as wearables, connected toys, and home assistants—provide a rich stream of data that can be leveraged to monitor children’s learning progress in real time. By integrating these tools into your enrichment program, you gain actionable insights, personalize instruction, and keep parents engaged.
1. Wearable Activity Monitors
- What they capture: Steps taken, heart rate variability (HRV), sleep patterns, and even movement intensity during physical education or dance sessions.
- Practical use case: A smartwatch paired with a custom app logs each child’s active minutes. The system flags when a student consistently falls below the recommended 60 minutes per day, prompting an intervention such as a short “movement break” activity.
- Data privacy tip: Store only aggregated metrics on your server; never log raw GPS or video data unless explicitly consented to by parents.
2. Interactive Learning Apps with API Hooks
- What they capture: Time spent per lesson, quiz scores, completion rates, and patterns of question difficulty.
- Practical use case: An educational math app sends a webhook to your LMS whenever a student finishes an assignment. Your dashboard automatically updates the child’s progress chart and triggers a notification to the teacher if performance dips below the 70 % threshold.
- Example integration: Use
WebhooksorREST APIsfrom platforms like Khan Academy to pull data into a custom WordPress plugin.
3. Smart Home Assistants for Language Practice
- What they capture: Voice interaction logs, response accuracy in pronunciation drills, and engagement duration.
- Practical use case: A child practices Spanish with a smart speaker that records correct vs. incorrect answers. The system aggregates weekly scores and sends an email summary to parents, highlighting strengths and areas for improvement.
- Implementation hint: Use the Alexa Skills Kit or Google Actions SDK to build a custom skill that logs interactions in a secure database.
4. Connected Toys and STEM Kits
- What they capture: Build completion status, sensor readings (e.g., temperature, light), and time stamps for each assembly step.
- Practical use case: A programmable robot kit logs the sequence of commands executed by a student. The data is visualized in a timeline view on the teacher’s dashboard, revealing whether students are following instructions or improvising creatively.
- Data handling note: Store only device identifiers and anonymized timestamps; avoid collecting personal content unless necessary.
5. Custom Dashboards & Reporting
- Create a WordPress plugin that aggregates data from all smart devices via API calls.
- Use chart libraries (e.g., Chart.js, D3.js) to display real‑time progress bars and trend lines.
- Set up automated alerts: if a student’s engagement drops below a threshold for three consecutive days, the system emails the teacher with suggested activities.
Best Practices Summary
- Consent first: Obtain explicit parental consent before collecting any data.
- Data minimization: Only collect metrics that directly inform enrichment outcomes.
- Secure storage: Use encrypted databases and regular backups.
- Transparency: Provide parents with dashboards showing what data is collected and how it’s used.
- Iterate: Regularly review analytics to refine learning pathways and device usage policies.
By thoughtfully integrating smart devices into your enrichment ecosystem, you transform raw sensor outputs into meaningful educational insights—empowering teachers, engaging parents, and most importantly, accelerating each child’s learning journey.
Real‑time Monitoring
Modern aquaculture operations can now harness the power of IoT to monitor enrichment protocols in real time. By integrating smart devices—such as temperature probes, pH meters, dissolved oxygen (DO) sensors, and even underwater cameras— managers gain instant insight into how effectively fish are accessing feed, how their environment responds, and whether any adjustments are needed. Below is a step‑by‑step guide on setting up a real‑time monitoring system, practical examples, and actionable tips for maximizing enrichment outcomes.
1. Selecting the Right Smart Devices
- Temperature Sensors: Keep water within optimal ranges (e.g., 24–28 °C for Atlantic salmon). Use waterproof probes with a data logger that can transmit via LoRa or cellular.
- Dissolved Oxygen (DO) Meters: DO levels above 6 mg/L are typically required for healthy growth. Deploy multi‑point DO sondes to capture spatial variation.
- pH Sensors: Maintain pH between 7.0 and 8.5. Smart pH meters can auto‑calibrate using buffer solutions and alert when deviations occur.
- Underwater Cameras & Video Analytics: Detect feeding behavior, schooling patterns, or stress indicators such as rapid swimming or surface gasping.
- Feed Delivery Sensors: Smart feeders can record the amount of feed dispensed and time stamps, allowing precise calculation of feed conversion ratios (FCR).
2. Building a Data Pipeline
The key to real‑time monitoring is a robust data pipeline that collects, processes, and visualizes sensor outputs. A typical architecture involves:
- Edge Layer: Sensors transmit raw data to local gateways (e.g., Raspberry Pi or industrial PLC).
- Cloud Integration: Data is pushed to a cloud platform (AWS IoT Core, Azure IoT Hub, or Google Cloud IoT) using MQTT.
- Analytics Engine: A time‑series database (InfluxDB, TimescaleDB) stores the data. Machine learning models can flag anomalies such as sudden drops in DO.
- Visualization Dashboard: Tools like Grafana or Power BI display real‑time graphs, heat maps, and alerts on a single screen.
3. Example Workflow: Feed Enrichment Tracking
Suppose you’re running a sea‑cage operation with automated feeders that release pellets every 15 minutes. Here’s how to monitor enrichment success:
- Step 1: The feeder logs the exact amount of feed released (e.g., 2 kg per cycle).
- Step 2: Cameras capture footage during each feeding event. Image‑processing algorithms count fish approaching the feed chute.
- Step 3: DO sensors record any changes in oxygen levels that might indicate increased respiration due to feeding.
- Step 4: The dashboard aggregates data:
- Feed delivered vs. fish count → Feed intake per fish.
- Water temperature & DO trends → Environmental stressors.
- Step 5: If the system detects that fewer than 70 % of fish are engaging with feed, an alert triggers. Managers can then adjust feed size or timing.
4. Practical Tips for Maximizing Enrichment Efficiency
- Use Adaptive Feeding Algorithms: Combine sensor data to predict optimal feeding times—e.g., when DO is high and temperature stable, the fish are most likely to feed.
- Calibrate Sensors Regularly: Temperature probes drift after 6–12 months. Perform a quick calibration check using a reference thermometer before each season.
- Implement Predictive Maintenance: Monitor battery voltage and signal strength of wireless devices to preempt failures during critical periods.
- Integrate with Farm Management Systems (FMS): Export enriched data into your FMS for comprehensive record‑keeping, enabling trend analysis over multiple seasons.
- Engage Fish Behaviorists: Periodically review camera footage to refine machine‑learning models and ensure that automated alerts correspond to real behavioral changes.
5. Case Study: A Pacific Northwest Salmon Farm
A salmon farm in Washington State deployed a network of 12 temperature probes, 8 DO sensors, and 4 high‑resolution cameras across its 20 m‑deep cages. After six months:
- FCR improved from 1.9 to 1.6 due to more precise feed delivery.
- Unplanned feed wastage dropped by 25 % because the system alerted operators to low fish activity during certain periods.
- The farm reduced labor hours on feeding checks by 30 % thanks to automated data collection.
6. Conclusion
Real‑time monitoring with smart devices transforms enrichment from a trial‑and‑error practice into a data‑driven process. By selecting appropriate sensors, building an efficient data pipeline, and applying actionable insights, aquaculture managers can ensure that fish receive the right amount of feed at the right time—maximizing growth, health, and profitability.
Cloud Integration
Smart devices—smartphones, wearables, IoT sensors, and connected appliances—are becoming essential tools for collecting real‑time data on customer behavior, product usage, and service quality. By integrating these devices into your cloud architecture you can continuously enrich your data lake, create richer user profiles, and deliver highly personalized experiences.
1. Data Capture Pipeline
- Device SDKs: Embed lightweight SDKs in mobile apps or firmware to push events (e.g., button taps, sensor readings) directly to your cloud API gateway.
- Edge Processing: Use edge devices (Raspberry Pi, Azure IoT Edge) to preprocess data—filter noise, aggregate metrics—to reduce bandwidth and latency.
- Message Queues: Route events through Kafka or RabbitMQ before ingestion into a cloud stream processing engine (AWS Kinesis, Google Cloud Pub/Sub).
2. Enrichment Strategies
- Geolocation Augmentation: Combine GPS coordinates from wearables with map APIs to add context like weather or traffic conditions.
- Behavioral Scoring: Apply machine learning models in the cloud (AWS SageMaker, Azure ML) to assign engagement scores based on interaction frequency and dwell time.
- Cross‑Device Correlation: Link a user’s smartphone activity with their smart TV usage by matching anonymized device identifiers; this yields a 360° view of consumer habits.
3. Real‑Time Analytics Dashboard
Create dashboards in Grafana or Power BI that visualize:
- Device Health Metrics: Battery levels, connectivity status, error rates.
- User Engagement Heatmaps: Time spent per feature across devices.
- Alerting Rules: Trigger notifications when a device falls below a performance threshold (e.g., sensor drift > 5%).
4. Privacy & Compliance
When enriching data from smart devices, always adhere to GDPR, CCPA, and industry best practices:
- Anonymization: Replace personal identifiers with salted hashes before storage.
- Consent Management: Use a consent SDK that records user permissions for each data type.
- Data Retention Policies: Automate deletion of raw logs after the defined retention period via cloud lifecycle rules.
5. Practical Implementation Example
Scenario: A fitness app wants to enrich user workout data with ambient temperature and humidity from a smart thermostat.
- The thermostat publishes sensor readings to an MQTT broker.
- A cloud function (AWS Lambda) subscribes to the topic, fetches the latest workout session from DynamoDB, and merges the environmental data.
- Enriched records are stored in a data lake (Amazon S3) and indexed in Athena for BI queries.
6. Key Takeaways
- Leverage device SDKs and edge processing to keep latency low.
- Use cloud‑native streaming services for scalable ingestion.
- Apply enrichment algorithms close to the source for immediate personalization.
- Always embed privacy controls from day one.
By following these steps, you can turn raw smart‑device data into actionable insights that drive product improvements and elevate customer experience.
Analytics Dashboard
Modern smart devices—smartphones, wearables, IoT sensors, and connected appliances—generate a wealth of data that can be leveraged to monitor how users engage with your content or products over time. By enriching your analytics dashboards with this real‑time, context‑aware information, you gain deeper insights into user behavior, preferences, and pain points.
1. Identify Key Data Points
- Location & Time: GPS coordinates or time zone of the device when a page is viewed.
- Device Type & OS: Differentiating between iOS, Android, Windows, etc., and device models.
- Battery Level & Signal Strength: Indicates user environment (e.g., low battery may correlate with shorter session lengths).
- Interaction Patterns: Swipe speed on a tablet or touch pressure on a smartphone.
2. Integrate Smart Device APIs
Most platforms provide SDKs that allow you to pull device metrics securely:
| Platform | SDK / API | Primary Use |
|---|---|---|
| Google Fit | Fitness API | Collect heart rate, step count, and activity type. |
| Apple HealthKit | HealthKit Framework | Access sleep data, workouts, and nutrition logs. |
| Amazon Alexa Smart Home | Alexa Smart Home API | Track device usage patterns in the home environment. |
3. Create Enrichment Pipelines
Use a combination of server‑side and client‑side scripts to attach device data to your analytics events.
// Example: Sending battery level with pageview event
navigator.getBattery().then(function(battery) {
  const event = {
    category: 'Device',
    action: 'Page View',
    label: document.title,
    batteryLevel: battery.level * 100 // percentage
  };
  ga('send', 'event', event.category, event.action, event.label, { 'battery': event.batteryLevel });
});
4. Visualize Progress in the Dashboard
- Heat Maps: Show where users are physically located while interacting with your site.
- Time‑Series Charts: Correlate battery level dips with session abandonment rates.
- Device Segmentation Tables: Compare engagement metrics across iOS vs. Android devices.
5. Practical Use Cases
- E‑commerce: Detect when a shopper’s device battery is low and trigger a push notification offering a discount to encourage completion of the purchase.
- Fitness Apps: Enrich workout logs with GPS data to show users a visual route on their dashboard, increasing engagement.
- Smart Home Services: Monitor when a smart thermostat is being adjusted during certain times of day and recommend energy‑saving tips.
6. Privacy & Compliance
Always obtain explicit user consent before collecting device data. Store information in compliance with GDPR, CCPA, or other relevant regulations. Use anonymization techniques (e.g., hashing IP addresses) and provide clear opt‑out mechanisms.
7. Next Steps
- Set up a test environment to capture sample device data.
- Map the captured metrics to your existing analytics schema.
- Create dashboards in tools like Google Data Studio, Power BI, or custom React components.
- Iterate based on insights—adjust content strategy or product features accordingly.
By systematically enriching your analytics with smart device data, you transform raw numbers into actionable intelligence that drives better user experiences and business outcomes.
Personalized Feedback
Smart devices—such as fitness trackers, smartwatches, and home assistants—have turned passive data collection into an active part of personal development. By integrating these tools into your enrichment routine, you can monitor progress in real time, receive actionable insights, and stay motivated to reach your goals.
1. Choosing the Right Device for Your Goals
- Fitness trackers (e.g., Fitbit, Garmin): Ideal for tracking steps, heart rate, sleep patterns, and calorie burn.
- Smartwatches (e.g., Apple Watch, Samsung Galaxy Watch): Provide more advanced metrics like VO₂ max, ECG, and workout-specific analytics.
- Home assistants (e.g., Amazon Echo, Google Home): Useful for setting reminders, logging meals, or coaching sessions via voice commands.
2. Setting Up Baseline Metrics
Before you can track progress, establish baseline values:
- Health metrics: Record resting heart rate, sleep duration, and daily steps.
- Skill development: Log initial proficiency scores for activities like language learning apps or coding challenges.
- Mental well-being: Use mood trackers in the device’s companion app to gauge baseline stress levels.
3. Integrating Data Across Platforms
Most smart devices sync with cloud services or third‑party apps (e.g., Strava, MyFitnessPal). Use these integrations to create a unified dashboard:
- IFTTT/Zapier workflows: Automatically push data from your smartwatch to Google Sheets for custom analysis.
- HealthKit/Google Fit: Consolidate metrics across iOS and Android ecosystems.
- API access: For advanced users, pull raw data via REST APIs and run statistical models or machine learning predictions.
4. Interpreting Trends and Setting SMART Targets
Use the device’s analytics to spot patterns:
- Weekly averages: Compare average steps or sleep hours against your target.
- Heat maps: Visualize activity distribution across days of the week.
- Goal streaks: Celebrate consistency by tracking consecutive days meeting a threshold.
5. Practical Tips for Maintaining Engagement
- Gamify your routine: Earn badges or unlock new features as you hit milestones.
- Use voice reminders: Set daily prompts on smart assistants to review progress or adjust workouts.
- Share insights with a community: Post anonymized data to forums or groups for peer feedback.
6. Example Workflow: Tracking a Running Goal
Suppose you aim to run 5 km every weekday:
- Device Setup: Pair your Garmin watch with the Strava app.
- Baseline Recording: Log a few trial runs to establish average pace and heart rate zones.
- Automated Sync: Every morning, Strava pulls the previous day’s run data into a Google Sheet.
- Analysis: Use a simple script (Python or Google Apps Script) to calculate weekly improvement percentage.
- Feedback Loop: If pace drops by >5%, trigger an email reminder to adjust training intensity.
7. Privacy & Data Security Considerations
When sharing or storing sensitive health data:
- Read privacy policies: Ensure your device’s data handling aligns with GDPR or CCPA.
- Use encrypted storage: Store spreadsheets in password‑protected cloud accounts.
- Limit sharing scope: Disable location tracking when not needed.
By thoughtfully integrating smart devices into your enrichment journey, you transform raw data into actionable insights—making progress visible, measurable, and ultimately more achievable.
Gamification Strategies
Smart devices—smartphones, tablets, wearables, and even connected home assistants—offer a wealth of data that can be leveraged to monitor how learners engage with enrichment activities. By integrating these tools into your gamified learning ecosystem, you gain real‑time insights, personalized feedback loops, and an engaging experience that keeps participants motivated.
1. Choose the Right Devices for Your Audience
- Smartphones & Tablets: Ideal for mobile quizzes, AR scavenger hunts, or interactive storytelling apps. They’re ubiquitous and support touch, camera, and location services.
- Wearables (smartwatches, fitness trackers): Perfect for gamified physical challenges—track steps, heart rate, or sleep patterns to reward healthy habits.
- Smart Home Assistants: Use voice commands to trigger quizzes or provide verbal encouragement. Great for hands‑free learning environments.
2. Capture Data Points that Matter
| Data Point | Why It Matters |
|---|---|
| Time Spent on Task | Shows engagement depth and helps adjust difficulty. |
| Accuracy/Score | Measures learning outcomes directly. |
| Interaction Frequency | Indicates motivation; can trigger bonus rewards. |
| Location Check‑Ins (GPS) | Useful for outdoor scavenger hunts or field trips. |
| Physiological Data (heart rate, steps) | Tracks physical activity in health‑focused gamification. |
3. Sync Data with Your Learning Management System (LMS)
- APIs & Webhooks: Most modern LMS platforms support RESTful APIs. Push device data to the LMS so that progress bars, leaderboards, and certificates update automatically.
- Data Privacy: Ensure GDPR or CCPA compliance—obtain explicit consent before collecting personal data.
- Visualization Dashboards: Use built‑in LMS dashboards or integrate with tools like Tableau or Power BI for richer analytics.
4. Turn Data into Gamified Feedback
Real‑time insights let you craft dynamic rewards:
- Instant Badges: Award a badge when a user reaches a milestone (e.g., “Completed 10 quizzes in a row”).
- Progress Bars & Milestone Celebrations: Visually display how close users are to the next level.
- Adaptive Challenges: If a learner consistently scores high, automatically unlock harder tasks; if struggling, provide hints or additional resources.
5. Sample Implementation Flow
1. User opens the mobile app & logs in.
2. App records start time and device sensors begin tracking (GPS, camera).
3. User completes a quiz; score & time are captured locally.
4. Data is sent via HTTPS POST to LMS API endpoint /enrichment/record
5. LMS validates, stores data, updates learner profile.
6. Leaderboard refreshes; user receives badge if criteria met.
6. Practical Tips for Educators
- Start Small: Pilot with one activity before scaling.
- Transparent Data Use: Explain to learners how their data fuels rewards—build trust.
- Multimodal Feedback: Combine visual (charts), auditory (voice praise), and haptic (vibration) cues for richer engagement.
- Regular Review Meetings: Use aggregated analytics to discuss progress with learners, set new goals, and celebrate achievements.
7. Example: Smartwatch‑Enabled Language Learning
A language course uses a smartwatch app that sends the learner’s heart rate during pronunciation drills. If the heart rate drops—indicating confidence—the system unlocks a “Fluency” badge and provides access to advanced conversational videos.
8. Conclusion
By harnessing smart device data, you transform passive learning into an interactive, feedback‑rich experience. Tracking enrichment progress becomes less about manual grading and more about real‑time, personalized motivation that keeps learners engaged and progressing toward their goals.
Privacy & Security
Modern smart devices—smartphones, wearables, home assistants, and connected appliances—collect a wealth of data that can be leveraged to enrich user profiles over time. By tracking how users interact with these devices, you can gain insights into their preferences, habits, and needs, enabling highly personalized experiences while still respecting privacy.
Key Data Points You Can Collect
- Location & Movement: GPS logs from smartphones or activity trackers reveal commuting patterns, favorite routes, and proximity to points of interest.
- Health & Activity Metrics: Step counts, heart rate, sleep stages, and workout types provide a picture of health goals and lifestyle.
- Voice & Interaction Patterns: Smart speakers capture spoken queries and commands, indicating preferred brands, services, or topics of interest.
- Device Usage Logs: Screen time, app launch frequency, and content consumption on smart TVs or tablets help map entertainment preferences.
- Environmental Sensors: Smart thermostats, lighting systems, and air quality monitors reveal comfort thresholds and energy usage habits.
How to Enrich the User Profile Over Time
- Aggregate Data from Multiple Sources: Combine smartphone logs with wearable data and smart home interactions to create a multi‑dimensional profile.
- Apply Temporal Analysis: Use time‑stamped events to detect seasonality (e.g., increased outdoor activity in summer) or life‑stage changes (moving to a new city).
- Segment Users Dynamically: Create dynamic segments such as “Early Adopters of Smart Thermostats” or “Nighttime Sleepers” that evolve as new data arrives.
- Model Predictive Behavior: Employ machine learning models to forecast future actions—e.g., predict when a user will likely order groceries based on past purchase timing and location proximity to supermarkets.
Practical Advice for Implementation
- Consent First: Always obtain explicit, granular consent before collecting data from smart devices. Provide clear explanations of what each data point is used for.
- Data Minimization: Collect only the data that directly supports your enrichment goals. Avoid “data hoarding.”
- Secure Storage & Access Controls: Store device data in encrypted databases and enforce strict role‑based access to limit exposure.
- Real‑Time Processing Pipelines: Use stream processing (e.g., Kafka, Flink) for low‑latency updates to user profiles, enabling instant personalization.
- Regular Audits & Transparency Reports: Publish annual transparency reports detailing data collection volumes, third‑party sharing, and deletion policies.
Example Use Cases
- Smart Home Energy Savings: Analyze thermostat patterns to recommend personalized energy‑saving tips, then send a notification via the homeowner’s smartphone app.
- Health Coaching App: Correlate wearable heart rate data with voice assistant queries about nutrition; suggest tailored meal plans delivered through push notifications.
- Retail Loyalty Program: Combine location data from smartphones with in‑store beacon signals to trigger instant coupons when a user enters a specific aisle.
Balancing Personalization and Privacy
The key to successful enrichment is transparency and control. Offer users an easy way to review, edit, or delete the data you’ve collected from their smart devices. Provide toggles for opting out of specific data types (e.g., location vs. health metrics) without losing core functionality.
Takeaway
By thoughtfully tracking and enriching progress with smart device data—while upholding strong privacy safeguards—you can deliver highly relevant, timely experiences that resonate with users on a personal level.
Compliance Standards
Modern learning environments increasingly rely on smart devices—tablets, smartphones, interactive whiteboards—to deliver personalized content and monitor student progress in real time. To ensure these tools are used effectively and responsibly, institutions must adhere to a set of compliance standards that cover data privacy, accessibility, interoperability, and pedagogical integrity.
1. Data Privacy & Security
- GDPR / FERPA Compliance: All student data captured by smart devices must be stored and processed in accordance with regional regulations. Use end‑to‑end encryption for transmission, and keep audit logs of who accessed the data.
- Consent Management: Implement a consent framework that allows parents or guardians to opt‑in or opt‑out of data collection. Provide clear, age‑appropriate explanations of what data is collected (e.g., screen time, interaction patterns).
- Device Authentication: Require biometric or two‑factor authentication before a device can access sensitive learning analytics.
2. Accessibility & Inclusive Design
- Ensure all tracking interfaces support screen readers and high‑contrast modes. Use ARIA labels for interactive elements.
- Provide alternative input methods (voice commands, stylus support) so that students with motor impairments can engage with the enrichment tools.
- Adopt universal design principles: color palettes that are dyslexia‑friendly and content that can be rearranged to suit different learning styles.
3. Interoperability & Standards
Smart devices should communicate with the Learning Management System (LMS) using open standards such as IMS Global Learning Tools Interoperability (LTI). This ensures that:
- Data flows seamlessly between the device and the LMS without custom integrations.
- Students can access their progress dashboards across multiple platforms (desktop, mobile).
- Third‑party analytics tools can plug into the ecosystem without violating data ownership agreements.
4. Pedagogical Integrity
Tracking should enhance learning, not become a punitive measure:
- Transparent Metrics: Share what metrics are tracked (e.g., time on task, quiz scores) and how they inform personalized feedback.
- Student Agency: Allow learners to set their own goals and review progress reports in a self‑paced manner.
- Teacher Moderation: Provide educators with dashboards that highlight trends but also flag anomalies for contextual investigation.
5. Practical Implementation Checklist
- Conduct a privacy impact assessment before deploying smart devices.
- Configure device management policies (MDM) to enforce encryption and remote wipe capabilities.
- Integrate LMS with LTI-compliant analytics tools; test data flow in a sandbox environment.
- Create a student progress portal that aggregates data from multiple smart devices.
- Schedule quarterly audits of compliance logs, accessibility features, and user feedback loops.
6. Example Scenario: Interactive Whiteboard Tracking
A teacher uses an interactive whiteboard to conduct a math lesson. As students solve problems on the board, the device captures:
- Number of attempts per problem.
- Time spent on each step.
- Correctness rate for each concept block.
This data is instantly pushed to the LMS via LTI, where it appears in a “Student Progress” module. The teacher can then generate a PDF report for parents, highlighting areas of strength and suggested enrichment activities— all while ensuring that the data remains encrypted and accessible only to authorized parties.
7. Resources & Further Reading
- Educause Digital Library – Smart Classroom Standards
- W3C Web Accessibility Initiative (WCAG)
- IMS Global LTI Specifications
By aligning smart device tracking with these compliance standards, educational institutions can create a safe, inclusive, and data‑driven learning environment that empowers both students and educators.
User Engagement Metrics
Smart devices—smartphones, wearables, and home assistants—provide a continuous stream of data that can be harnessed to monitor how users are engaging with your content or product. By integrating these signals into your analytics stack, you gain real‑time insights into user behavior, enabling more precise personalization and timely interventions.
Key Metrics to Capture
- Session Duration on Mobile: Average time users spend interacting with your app or website from their phone.
- Interaction Frequency: How often a user opens the app, reads an article, or triggers a smart home routine related to your service.
- Device‑Specific Drop‑off Points: Pages or steps where users abandon the flow on specific devices (e.g., iOS vs. Android).
- Voice Command Success Rate: Percentage of voice queries that return a relevant result, indicating how well your content is indexed for smart assistants.
Practical Implementation Steps
- Enable Cross‑Device Tracking: Use Google Analytics’ User ID feature or Facebook’s Offline Conversions API to stitch together sessions from the same user across devices. Assign a unique identifier that persists in local storage and syncs with your backend.
-
Instrument Smart Device APIs:
- Smartphone Apps: Integrate Firebase Analytics or Mixpanel SDKs to capture event data.
- Wearables: Use the Apple HealthKit or Google Fit API to pull activity metrics and correlate them with content consumption.
- Home Assistants: Register your skill/Action on Alexa Skills Kit or Google Actions, then log intent fulfillment data via Cloud Functions.
- Set Up Real‑Time Dashboards: Connect your analytics platform to Grafana or Power BI. Use WebSocket endpoints from your backend to push live device events so marketers can see engagement spikes as they happen.
-
Define Enrichment Milestones:
- “First 5 minutes of active listening on Alexa” → trigger a congratulatory in‑app message.
- “Completing 3 workout sessions via Apple Watch” → unlock premium content.
- Automate Feedback Loops: Configure rules in your CRM (e.g., HubSpot) to send personalized emails when a user hits a milestone or shows signs of disengagement on mobile.
Case Study Snapshot
FitTrack App integrated Fitbit data to monitor daily steps and correlate them with article reads about nutrition. By tagging each article with a unique article_id, they found that users who logged >10,000 steps in a day were 35% more likely to read the “Post‑Workout Recovery” guide. This insight led to push notifications nudging high‑step users toward related content, boosting overall engagement by 18%.
Best Practices & Pitfalls
- Respect Privacy: Always obtain explicit consent before collecting health or location data. Use anonymized identifiers where possible.
- Normalize Time Zones: Smart devices may report timestamps in local time; convert to UTC for consistent aggregation.
- Handle Offline Events: Store events locally on the device and sync them when connectivity is restored to avoid data loss.
- Avoid Data Over‑collection: Focus on metrics that directly influence user journey stages; too many variables can dilute actionable insights.
Next Steps
Start by mapping your most valuable touchpoints to device categories, then build a lightweight event schema. Pilot the tracking with a small cohort of users, validate data quality, and scale once you’re confident in signal integrity. Remember: the goal is not just to collect data, but to transform it into timely actions that enrich user experience.
Success Case Studies
Smart devices—ranging from fitness trackers and smart watches to connected home appliances and wearable health monitors—have revolutionized how we measure personal growth, wellness, and learning outcomes. By harnessing the data these gadgets generate, individuals and organizations can create transparent, actionable progress dashboards that keep motivation high and outcomes on target.
1. The Core Benefits
- Real‑time feedback: Devices send instantaneous metrics (steps taken, heart rate variability, sleep quality) so users see how their actions affect results immediately.
- Objective measurement: Removes guesswork from self‑reporting; data is collected automatically and verified by the device’s sensors.
- Longitudinal analysis: Accumulated data over weeks or months lets users spot trends, plateaus, and breakthrough moments.
2. Practical Use Cases
A. Fitness & Wellness Programs
Corporate wellness initiatives often integrate Fitbit, Apple HealthKit, or Google Fit data into a central dashboard. Employees can set weekly step goals, track sleep stages, and receive automated nudges when they fall behind.
B. Educational Enrichment
Teachers use Kindle Fire tablets paired with learning apps that log reading time, quiz scores, and engagement patterns. The aggregated data feeds into a parent portal, allowing parents to see their child’s progress in real time.
C. Skill‑building Apps
Language learning platforms like Duolingo track daily streaks and mastery levels. When combined with smart speaker logs (e.g., Alexa or Google Home), users can practice pronunciation, receiving instant corrections from the device.
3. Building Your Own Tracking Dashboard
- Select Compatible Devices: Choose devices that expose APIs—most modern wearables do. Ensure they support OAuth for secure data access.
- Define Key Metrics: Identify the KPIs that matter most (e.g., weekly steps, average sleep duration, quiz score). Keep the list concise to avoid overwhelm.
- Create a Data Pipeline: Use middleware like Zapier or Integromat to pull data from device APIs into a cloud database (Google Sheets, Airtable).
- Visualize with Dashboards: Tools such as Google Data Studio, Power BI, or custom WordPress plugins can turn raw numbers into interactive charts.
- Automate Alerts: Set up email or SMS triggers when metrics dip below thresholds. For instance, “You’ve slept less than 6 hours for three consecutive nights—time to reset your bedtime routine.”
4. Tips for Sustained Engagement
- Gamify Progress: Add badges or level‑up systems that unlock when users hit milestones.
- Share Achievements: Integrate social sharing buttons so users can post progress on Facebook, Twitter, or LinkedIn.
- Provide Contextual Coaching: Pair data with actionable tips—e.g., if sleep quality drops, recommend breathing exercises.
- Respect Privacy: Clearly state what data is collected and how it’s used. Offer opt‑out options for sensitive metrics.
5. Real‑World Success Story
“FitLife,” a startup offering personalized fitness coaching, partnered with Garmin Connect. By pulling daily activity data into their platform, they could automatically adjust workout plans based on real performance. Within six months, members reported a 30% increase in consistency and a 15% faster achievement of weight‑loss goals.
Conclusion
Tracking enrichment progress with smart devices turns abstract aspirations into tangible data points. By selecting the right tools, building clear dashboards, and fostering engagement through gamification and timely feedback, individuals can stay motivated while organizations gain measurable ROI on their development programs.
Future Trends
As the Internet of Things (IoT) continues to permeate every aspect of our lives, smart devices are becoming indispensable tools for tracking and enhancing personal development. From wearable fitness trackers that monitor heart rate variability to AI‑powered language learning apps that adapt in real time, these technologies offer granular insights into how we grow and learn.
Key Metrics You Can Capture
- Physical Activity: Steps taken, calories burned, active minutes. Useful for setting daily movement goals or evaluating the effectiveness of a new exercise routine.
- Cognitive Load: Brain‑wave patterns (via EEG headbands), reaction times on memory tasks, or error rates in learning apps.
- Emotional State: Heart rate variability (HRV) and skin conductance measured by smartwatches to infer stress levels.
- Sleep Quality: Duration, REM cycles, and sleep efficiency reported by sleep‑tracking wearables.
Practical Workflow for Enrichment Tracking
- Select the Right Device: Choose a device that aligns with your enrichment goal. For example, use a Polar H10 heart rate sensor if you want to monitor training intensity, or a Muse 2 headband for meditation progress.
- Integrate Data: Most smart devices offer APIs (e.g., Fitbit Web API, Apple HealthKit). Use these to pull data into a central dashboard or spreadsheet. Tools like Make (formerly Integromat) can automate data sync.
- Create Benchmarks: Define baseline metrics and set realistic milestones. For instance, aim to increase active minutes from 30 to 45 per day over a month.
- Visualize Progress: Use charts (Google Charts, Chart.js) or BI tools (Power BI, Tableau) to plot trends. Visual patterns help spot plateaus and celebrate wins.
- Iterate Based on Insights: If HRV remains low despite increased activity, consider adding a mindfulness session. Adjust your plan based on data-driven feedback.
Case Study: Language Learning with Smart Devices
A user combined the Anki flashcard app with an Apple Watch. The watch tracked daily active minutes, while Anki logged review frequency and recall accuracy. By correlating high activity days with better recall rates, the learner discovered that short bursts of exercise before study sessions improved memory retention.
Future Outlook
- Adaptive Learning Algorithms: Devices will increasingly provide real‑time feedback and adjust difficulty levels automatically.
- Cross‑Device Synchronization: Seamless data flow between wearables, smart home assistants, and mobile apps will offer a holistic view of enrichment.
- Privacy‑First Data Handling: Enhanced local storage options and transparent consent mechanisms will empower users to control their own progress data.
By harnessing the capabilities of smart devices, you can transform abstract growth goals into measurable, actionable steps—making personal enrichment a data‑driven journey rather than an elusive aspiration.
Conclusion
When you’re investing in your child’s learning and development, the real value lies not only in the activities themselves but also in how you measure their impact. Modern smart devices—tablets, smartphones, wearables, and connected home assistants—offer a suite of tools that can turn raw data into actionable insights. Below is a practical guide to harnessing these technologies for tracking enrichment progress.
1. Choose the Right App Ecosystem
- Educational Platforms with Built‑in Analytics: Apps such as Khan Academy Kids, ABCmouse, and Seesaw automatically log time spent, quizzes completed, and skill mastery. They provide dashboards for parents to review trends over weeks or months.
- Customizable Learning Journals: Tools like Journey or Day One let you attach screenshots, audio notes, or video clips of your child’s work. Tagging these entries with keywords (e.g., “science experiment,” “music practice”) makes later searches effortless.
- Gamified Learning Apps: Games that reward points for consistent practice (e.g., Duolingo, Quizizz) provide a natural way to track engagement and skill progression. Look for apps that export data in CSV or PDF format for deeper analysis.
2. Leverage Wearables for Physical Activity & Cognitive Load
Smartwatches and fitness bands can monitor heart rate variability, sleep patterns, and steps taken—indicators of overall well‑being that influence learning capacity.
- Heart Rate Variability (HRV): Low HRV during study sessions may signal stress. Many wearables allow you to set alerts when HRV drops below a threshold, prompting a short break or breathing exercise.
- Sleep Tracking: Consistent sleep of 9–12 hours for children aged 6‑12 is crucial. Apps like Apple Health or Google Fit can sync with your phone, giving you a weekly summary that correlates with academic performance.
- Step Counters: Encourage active breaks by setting step goals between study blocks. A simple 10‑minute walk can reset attention spans and improve memory consolidation.
3. Use Voice Assistants for Routine Check‑Ins
Smart speakers (Google Home, Amazon Echo) can be programmed to run daily or weekly check‑in routines.
- Daily Recap: “Hey Alexa, what did Lily learn today?” The assistant pulls data from connected apps and provides a spoken summary of completed lessons, quiz scores, and time spent.
- Progress Reminders: Set up reminders to review the child’s learning journal or to schedule the next enrichment session.
4. Create a Unified Dashboard
While each tool offers its own analytics, integrating them into a single dashboard yields holistic insights. Use platforms like Google Data Studio, Microsoft Power BI, or even a simple Google Sheet with IMPORTRANGE and GOOGLEFINANCE functions.
- Key Metrics: Time spent on learning vs. total screen time, quiz pass rates, sleep quality scores, and physical activity minutes.
- Visualization Tips: Line charts for weekly trends, bar graphs comparing skill levels across subjects, heat maps showing peak study times.
5. Set SMART Goals and Review Regularly
With data at hand, you can define Specific, Measurable, Achievable, Relevant, and Time‑bound objectives:
| Goal | Metric | Target |
|---|---|---|
| Improve reading comprehension | Reading score on app quizzes | +10% in 8 weeks |
| Increase physical activity during breaks | Steps per break session | ≥1,000 steps per break |
| Enhance sleep consistency | Average nightly hours | 10‑12 hrs nightly |
Schedule a bi‑weekly family review: pull the dashboard, celebrate milestones, and adjust strategies. This collaborative approach keeps everyone accountable and ensures that enrichment remains purposeful rather than arbitrary.
6. Privacy & Safety First
- Use secure, child‑friendly apps with parental controls.
- Regularly review permissions: limit location sharing, data export settings, and third‑party integrations.
- Encourage digital hygiene—set screen time limits and educate children about safe online practices.
By combining the immediacy of smart device data with thoughtful goal setting, you can transform enrichment from a series of activities into a measurable, evolving journey. The insights gained not only guide your child’s learning path but also empower you to celebrate progress in real time.
FAQ
Modern smart devices—smartwatches, fitness trackers, and even home assistants—offer a wealth of data that can help you monitor how well your educational or personal development programs are working.
Why Track Enrichment Progress?
- Real‑time feedback: See immediately if a student is grasping new concepts.
- Personalized interventions: Adjust pacing or content based on sensor data.
- Motivation boost: Gamified progress bars keep learners engaged.
Key Metrics to Capture
| Metric | Description | Device Example |
|---|---|---|
| Heart Rate Variability (HRV) | Higher HRV often indicates better focus and learning readiness. | Apple Watch, Garmin Vivosmart |
| Sleep Quality Score | Improved sleep correlates with stronger memory consolidation. | Fitbit Charge, Oura Ring |
| Step Count & Activity Level | Physical movement can reset attention span during study sessions. | Google Fit, Samsung Health |
| Ambient Light & Noise Levels | Optimal learning environments have balanced lighting and low background noise. | Smart bulbs with built‑in sensors, Alexa Smart Plug |
Practical Implementation Steps
- Choose the Right API: Most devices expose REST or Bluetooth APIs. For example, Fitbit Web API lets you pull sleep and activity data.
- Set Up a Data Pipeline:
- Device → Cloud Storage (AWS S3, Google Cloud)
- Cloud → Analytics Engine (Python, R, or Azure ML)
- Analytics → Dashboard (Grafana, Power BI)
- Create a Composite Score: Combine HRV, sleep quality, and activity into a single “Enrichment Readiness” metric. Example formula:
Readiness = 0.4 * (HRV / MaxHRV) + 0.3 * (SleepScore / 100) + 0.3 * (ActivityLevel / MaxSteps)
- Integrate with Learning Management Systems: Use LTI or custom APIs to push the readiness score into LMS dashboards, allowing instructors to see each learner’s state.
Example: Tracking a Language Learner's Progress
A language tutor uses an Apple Watch to monitor a student’s HRV during pronunciation drills. The watch data is sent to a Google Cloud Function that updates the student's readiness score in Moodle. If the score dips below 0.5, the system automatically schedules a short breathing exercise and suggests a 10‑minute break before continuing with new lessons.
Privacy & Consent Considerations
- Always obtain explicit consent from users before collecting biometric data.
- Use tokenized identifiers to keep personal data separate from academic records.
- Comply with GDPR, CCPA, and other relevant regulations.
Troubleshooting Common Issues
| Error | Cause | Fix |
|---|---|---|
| API Rate Limit Exceeded | Too many requests in a short time. | Implement exponential backoff and cache responses. |
| Missing HRV Data | Device not capturing heart rate accurately (e.g., low battery). | Prompt user to recharge or recalibrate the sensor. |
Next Steps for Educators
- Start with one metric (e.g., sleep quality) and expand gradually.
- Pilot the system with a small group of students before scaling.
- Collect qualitative feedback to refine data interpretation models.
By weaving smart device data into your enrichment tracking strategy, you can create a responsive learning environment that adapts in real time to each learner’s physical and cognitive state.
Categories
- AI & Enrichment Play
- Broiler Farming
- Broiler Farming Tips
- Canine Wellness & Longevity
- Cat
- Cat & Human Connection
- Cat Adoption & Rescue
- Cat Breeds
- Cat Breeds & Personalities
- Cat Care & Health
- Cat Grooming & Hygiene
- Cat Lifestyle & Environment
- Cat Myths & History
- Cat Nutrition & Diet
- Cat Products & Reviews
- Cat Training & Behavior
- Comparison
- Consumer Awareness
- Dog
- Dog Accessories & Products
- Dog Adoption & Rescue
- Dog Breed & Lifestyle Trends
- Dog Breeding & Puppies
- Dog Entertainment & Media
- Dog Fashion & Trends
- Dog Fun & Lifestyle
- Dog Grooming & Hygiene
- Dog History & Culture
- Dog Myths, Science & Future Tech
- Dog News & Trends
- Dog Nutrition & Food
- Dog Psychology & Emotions
- Dog Safety & Security
- Dog Sports & Activities
- Dog Technology & Innovation
- Dog Training for Modern Owners
- Dog Travel & Adventure
- Dog Travel, Adventure & Culture
- Economic and Market Insights
- Educational Content
- FAQs
- Feeding Alternatives
- Festivals & Seasonal Ideas
- Fun & Entertainment
- General Knowledge
- General Pig Farming
- Health & Disease Management
- Housing and Environment
- Kittens
- Market Insights
- Miscellaneous
- Miscellaneous
- Motivational
- pig
- Pig Breeding
- Pig Breeds
- Pig Farming Stories and Inspiration
- Pig Health and Care
- Pig Nutrition
- Pig Products
- Profitability & Business
- Puppy Care
- Puppy Predictable Topics Reinvented
- Regional Focus
- Rescue & Adoption Buzz
- Senior Cats
- Senior Dog Care
- Smart Dog Tech & Gadgets
- Sustainability
- Sustainable & Eco-Friendly Dog Products
- Tech & Innovations
- Working & Service Dogs
- Broiler Feed66 products
- Country Feed33 products
- Pig Feed66 products
- Product22 products
- Raw Materials99 products
Products
-
 Fish Meal
₹1,999.00 – ₹2,999.00Price range: ₹1,999.00 through ₹2,999.00Rated 0 out of 5
Fish Meal
₹1,999.00 – ₹2,999.00Price range: ₹1,999.00 through ₹2,999.00Rated 0 out of 5 -
 FATTENING BROILER FEED
₹2,299.00 – ₹2,349.00Price range: ₹2,299.00 through ₹2,349.00Rated 0 out of 5
FATTENING BROILER FEED
₹2,299.00 – ₹2,349.00Price range: ₹2,299.00 through ₹2,349.00Rated 0 out of 5 -
 LAYER COUNTRY FEED
₹1,549.00 – ₹1,649.00Price range: ₹1,549.00 through ₹1,649.00Rated 0 out of 5
LAYER COUNTRY FEED
₹1,549.00 – ₹1,649.00Price range: ₹1,549.00 through ₹1,649.00Rated 0 out of 5 -
 COUNTER BROILER FEED
₹1,199.00 – ₹1,299.00Price range: ₹1,199.00 through ₹1,299.00Rated 0 out of 5
COUNTER BROILER FEED
₹1,199.00 – ₹1,299.00Price range: ₹1,199.00 through ₹1,299.00Rated 0 out of 5 -
 LACTATING PIG FEED
Rated 0 out of 5
LACTATING PIG FEED
Rated 0 out of 5₹2,299.00Original price was: ₹2,299.00.₹1,740.00Current price is: ₹1,740.00. -
 Maize
Rated 0 out of 5
Maize
Rated 0 out of 5₹1,650.00Original price was: ₹1,650.00.₹1,300.00Current price is: ₹1,300.00. -
 GESTATION PIG FEED (Phase 1)
Rated 0 out of 5
GESTATION PIG FEED (Phase 1)
Rated 0 out of 5₹2,249.00Original price was: ₹2,249.00.₹1,699.00Current price is: ₹1,699.00. -
 Pre Starter Broiler Feed
₹2,399.00 – ₹2,499.00Price range: ₹2,399.00 through ₹2,499.00Rated 0 out of 5
Pre Starter Broiler Feed
₹2,399.00 – ₹2,499.00Price range: ₹2,399.00 through ₹2,499.00Rated 0 out of 5 -
 FINISHER PIG FEED
Rated 0 out of 5
FINISHER PIG FEED
Rated 0 out of 5₹2,299.00Original price was: ₹2,299.00.₹1,749.00Current price is: ₹1,749.00. -
 Broiler Premix
Rated 0 out of 5
Broiler Premix
Rated 0 out of 5₹820.00Original price was: ₹820.00.₹699.00Current price is: ₹699.00.