

Unlock real-time training insights instantly
Unveil Hidden Training Secrets Using Real‑Time Insight Dashboards
Table of Contents
- Introduction to Monitoring Training Progress
- Why Use Application Insights for ML Workflows?
- Setting Up an Azure App Insights Resource
- Instrumenting Your Training Pipeline
- Tracking Key Metrics (Loss, Accuracy, etc.)
- Logging Custom Events and Properties
- Capturing Performance Counters and Resource Usage
- Using Telemetry Initializers for Contextual Data
- Visualizing Training Progress with Dashboards
- Alerting and Thresholds for Early Warning
- Comparing Multiple Runs and A/B Testing
- Integrating with CI/CD Pipelines
- Security, Privacy, and Data Governance Considerations
- Conclusion
- FAQ
Introduction to Monitoring Training Progress
In today’s fast‑moving business landscape, continuous learning is no longer optional—it's a strategic imperative. Whether you’re rolling out an internal skill‑up program or launching a customer-facing certification path, the key to success lies in understanding how participants are progressing and where they might be encountering roadblocks. Monitoring training progress provides actionable insights that help educators refine content, adjust pacing, and ultimately ensure higher completion rates and better learning outcomes.
Why Tracking Matters
- Early Intervention: Spot learners who are lagging behind and offer targeted support.
- Data‑Driven Decisions: Use real metrics to shape curriculum updates instead of relying on intuition.
- Stakeholder Reporting: Provide transparent progress dashboards for managers, sponsors, and learners themselves.
- Continuous Improvement: Identify which modules are most engaging or where drop‑off rates spike.
Choosing the Right Tool: Azure Application Insights
While many LMS platforms come with built‑in analytics, Azure Application Insights (App Insights) offers a powerful, developer‑friendly way to capture granular telemetry. It’s especially useful when your training content is embedded in web applications or microservices that already emit logs and events.
Key Features for Training Analytics
- Custom Events: Log “LessonCompleted”, “QuizAttempted”, or “ModuleStarted” with contextual properties (user ID, module ID, timestamp).
- User Sessions: Track session length and frequency to detect engagement patterns.
- Analytics Dashboards: Build Power BI reports that surface completion rates, average scores, and time‑to‑completion.
- Alerting: Configure alerts for abnormal dropout spikes or sudden performance drops.
Implementing Tracking in Your Training App
Below is a concise example of how you might instrument a simple learning module using the JavaScript SDK. Replace placeholders with your actual identifiers.
// Initialize App Insights
const appInsights = window.appInsights || function(config) {
  // ...SDK bootstrap code (omitted for brevity)
};
appInsights.loadAppInsights({
  instrumentationKey: "YOUR_INSTRUMENTATION_KEY"
});
appInsights.trackPageView();

// Log a lesson start event
function onLessonStart(lessonId) {
  appInsights.trackEvent("LessonStarted", { lessonId, userId: getCurrentUserId() });
}

// Log completion with score
function onLessonComplete(lessonId, score) {
  appInsights.trackEvent("LessonCompleted", {
    lessonId,
    userId: getCurrentUserId(),
    score,
    duration: calculateDuration()
  });
}
Practical Tips for Data Hygiene
- Normalize User IDs: Use a consistent identifier across systems to merge data accurately.
- Time Zone Awareness: Store timestamps in UTC and convert on the client side when displaying.
- Privacy Compliance: Mask personally identifiable information (PII) before exporting reports to third‑party tools.
From Data to Action
Once you’ve collected telemetry, the real work begins: interpreting it. Here are three quick actions you can take right away:
- Drop‑off Analysis: If 40% of learners abandon Module 3 after the quiz, investigate whether the content is too dense or if the quiz is misaligned with learning objectives.
- Performance Segmentation: Group learners by completion time and score to identify high‑performers who might benefit from advanced challenges.
- Feedback Loops: Use insights to schedule live Q&A sessions or create targeted micro‑learning resources for struggling cohorts.
By systematically tracking training progress with Azure Application Insights, you transform raw usage data into a strategic asset that drives curriculum excellence and learner success.
Why Use Application Insights for ML Workflows?
Monitoring training progress is the lifeblood of any successful machine‑learning pipeline. When you integrate Azure Application Insights into your workflow, you gain real‑time visibility into model performance, resource utilization, and operational health—all without adding complex instrumentation or new tooling. Below we explore how App Insights can be leveraged to track training jobs, surface actionable insights, and streamline collaboration across data science and DevOps teams.
1. Real‑Time Metrics Collection
- Custom counters: Log epoch number, loss value, accuracy, F1‑score, or any domain‑specific metric directly to App Insights using the
TelemetryClient.TrackMetric()API. - Resource usage: Capture GPU/CPU utilisation, memory consumption, and disk I/O by querying Azure Monitor logs and forwarding them as custom events.
- Training duration: Measure the elapsed time for each epoch or batch with high‑resolution timestamps.
2. Visualizing Training Progress
With Application Insights, you can create dashboards that display live graphs of your training metrics:
- Create a new Azure Dashboard.
- Add a “Metrics” tile. Select the Application Insights resource and filter by metric name (e.g.,
EpochLoss,Accuracy). - Set refresh interval. For deep learning jobs that run for hours, a 30‑second or minute refresh keeps stakeholders up to date.
Example: A convolutional neural network (CNN) training on ImageNet shows a live loss curve that drops from 2.3 to < 0.5 over 50 epochs, enabling the team to spot plateaus early and trigger hyper‑parameter tuning automatically.
3. Alerting and Incident Management
Define thresholds that trigger alerts when training stalls or degrades:
- Loss plateau detection: If loss does not improve by at least
0.01over five consecutive epochs, send an email to the data‑science squad. - Resource exhaustion: Alert when GPU memory usage exceeds 90% for more than 2 minutes.
- Integrate with Azure DevOps Pipelines to automatically rollback or scale resources upon alert receipt.
4. Debugging and Root‑Cause Analysis
When a model underperforms, Application Insights lets you drill down into the exact training run:
- Search by Run ID. Use the “Search” pane to locate all telemetry tagged with a unique
RunId. - Inspect custom events. Review logged hyper‑parameter sets, data augmentation flags, and optimizer settings that might have contributed to the issue.
- Correlate with environment logs. Cross‑reference training telemetry with Azure Container Instances or Kubernetes pod logs to identify infrastructure bottlenecks.
5. Collaboration Across Teams
By exposing a single source of truth for training metrics, you break silos:
- Data scientists: Focus on model architecture while relying on App Insights to monitor performance and resource health.
- Operations engineers: Use telemetry to optimize scaling policies and manage cost budgets.
- Product managers: Visual dashboards provide executive‑level insight into ML delivery timelines.
6. Practical Implementation Snippet
Below is a concise example in Python using the opencensus-ext-azure-appinsights library to log training metrics during a PyTorch loop:
from opencensus.ext.azure.log_exporter import AzureLogHandler
import logging

# Configure logger
logger = logging.getLogger(__name__)
handler = AzureLogHandler(connection_string='InstrumentationKey=YOUR_KEY')
logger.addHandler(handler)

for epoch in range(num_epochs):
    train_loss, acc = run_epoch(model, loader)
    logger.info(
        f'Epoch:{epoch}',
        extra={
            'custom_dimensions': {
                'EpochLoss': train_loss,
                'Accuracy': acc,
                'RunId': job_id
            }
        }
    )
With minimal code changes, every epoch’s loss and accuracy are streamed to Application Insights, where they can be visualised, alerted on, or investigated.
7. Cost Considerations & Best Practices
- Telemetry volume: Limit custom events to critical metrics; use
TrackMetric()for high‑frequency data instead of full events. - Sampling: Enable adaptive sampling (default 1%) if training jobs generate thousands of logs per second.
- Data retention: Set an appropriate retention period (e.g., 90 days) to balance storage costs and historical analysis needs.
By embedding Application Insights into your ML lifecycle, you transform raw training data into actionable intelligence—accelerating model iteration, reducing downtime, and ensuring that every stakeholder has a clear view of progress.
Setting Up an Azure App Insights Resource
Before you can start monitoring your training pipeline with App Insights, you must create an Application Insights resource in the Azure portal and embed its instrumentation key into your WordPress‑based training application. The following steps walk you through the entire process from portal navigation to code integration.
1. Create the Resource
- Log into the Azure Portal: Navigate to https://portal.azure.com.
- Search for “Application Insights”. Click on Create a resource.
- Fill in the basic information:
- Name: Choose something descriptive, e.g.,
TrainingAppInsights. - Subscription: Pick your active subscription.
- Resource group: Create a new one or reuse an existing group (e.g.,
TrainingResources). - Region: Select the region closest to your user base for lower latency.
- Name: Choose something descriptive, e.g.,
- Application Type: For a WordPress site, select Web Application (PHP). If you’re using a different language or platform, choose accordingly.
- Click Create. The deployment will take a few minutes.
2. Retrieve the Instrumentation Key
Once the resource is ready:
- Navigate to the resource’s overview page.
- Under Instrumentation key, click Copy.
- Store this value securely; you’ll need it in your WordPress configuration.
3. Install the App Insights PHP SDK (Optional)
If you prefer to send telemetry directly from PHP code, use Composer:
composer require microsoft/applicationinsights-php
Add the following bootstrap snippet to your WordPress wp-config.php or a custom plugin file:
require_once __DIR__ . '/vendor/autoload.php';
use Microsoft\ApplicationInsights\Channel\IngestionHttpClient;
use Microsoft\ApplicationInsights\Telemetry\Client;

$client = new Client('YOUR_INSTRUMENTATION_KEY_HERE');
$client->sendRequest(); // Example usage
Replace 'YOUR_INSTRUMENTATION_KEY_HERE' with the key you copied earlier.
4. Integrate via WordPress Plugin (Recommended)
Create a lightweight plugin that automatically injects the App Insights JavaScript SDK into every page:
/*
Plugin Name: WP App Insights Monitor
Description: Sends page view and custom events to Azure Application Insights.
Version: 1.0
Author: Your Name
*/
defined('ABSPATH') or die();
function wp_ai_enqueue_scripts() {
$instrumentationKey = 'YOUR_INSTRUMENTATION_KEY_HERE';
?>
Activate the plugin from the WordPress admin area. Every page load will now generate a PageView event in App Insights.
5. Sending Custom Training Events
During your training pipeline, you can push meaningful events to help diagnose progress or failures:
// Example: Log when a model checkpoint is saved
appInsights.trackEvent({
    name: "CheckpointSaved",
    properties: {
        epoch: 5,
        accuracy: 0.87,
        loss: 0.23
    }
});
In PHP, you can use the SDK’s trackEvent() method similarly.
6. Verify Data in Azure Portal
- Go to your Application Insights resource.
- Select Live Metrics Stream to see real‑time page views and custom events.
- Use Analytics (Kusto) queries for deeper insights. For example:
T
| where cloud_RoleName == "WordPressSite"
| summarize count() by name, timestamp
Practical Tips & Common Pitfalls
- Instrumentation Key Leakage: Never expose the key in public repositories. Store it in environment variables or WordPress
.envfiles. - Page View Flooding: If you have heavy AJAX usage, consider throttling PageView events to avoid skewed data.
- Sampling: For high‑traffic sites, enable adaptive sampling in the portal to reduce ingestion costs without losing trend fidelity.
Instrumenting Your Training Pipeline
When training machine‑learning models, especially at scale, it’s easy to lose visibility into what’s happening inside the pipeline. Instrumentation turns a black box into a transparent system you can monitor, debug, and optimize. One of the most powerful ways to do this in the Azure ecosystem is by sending telemetry from your training jobs directly to Azure Application Insights. Below we walk through why instrumentation matters, how to set it up with Python, and best‑practice patterns for collecting meaningful metrics.
Why Instrumentation Matters
- Early fault detection: Spot data quality issues or training stalls before they consume hours of compute.
- Performance tuning: Correlate batch sizes, learning rates, and GPU utilization to final accuracy.
- Cost control: Track run‑time and resource usage so you can shut down runaway experiments.
- Reproducibility: Store hyperparameters and environment details automatically for future audits.
Getting Started with App Insights in a Training Job
Below is a minimal, reproducible example using PyTorch. The same concepts apply to TensorFlow or scikit‑learn.
import os
from azure.applicationinsights import TelemetryClient
import torch
import time

# 1️⃣ Load the instrumentation key from Azure Key Vault or environment
INSTRUMENTATION_KEY = os.getenv("APPINSIGHTS_INSTRUMENTATIONKEY")

# 2️⃣ Create a telemetry client
tc = TelemetryClient(INSTRUMENTATION_KEY)

def log_metric(name, value, step=None):
    """Send a custom metric to App Insights."""
    tc.track_metric(name=name, value=value, properties={"step": str(step)})

def log_event(event_name, properties=None):
    """Log an event (e.g., epoch start/end)."""
    tc.track_event(name=event_name, properties=properties or {})

# 3️⃣ Dummy training loop
model = torch.nn.Linear(10, 1)
optimizer = torch.optim.Adam(model.parameters(), lr=0.001)
criterion = torch.nn.MSELoss()

num_epochs = 5
for epoch in range(num_epochs):
    start_time = time.time()
    log_event("epoch_start", {"epoch": epoch})

    # Simulate a batch loop
    for _ in range(20):  # 20 batches per epoch
        inputs = torch.randn(32, 10)
        targets = torch.randn(32, 1)

        optimizer.zero_grad()
        outputs = model(inputs)
        loss = criterion(outputs, targets)
        loss.backward()
        optimizer.step()

    elapsed = time.time() - start_time
    log_metric("epoch_loss", loss.item(), step=epoch)
    log_metric("epoch_runtime_sec", elapsed, step=epoch)

    # Optionally capture GPU memory usage (if using CUDA)
    if torch.cuda.is_available():
        mem_alloc = torch.cuda.memory_allocated()
        mem_reserved = torch.cuda.memory_reserved()
        log_metric("gpu_mem_alloc_bytes", mem_alloc, step=epoch)
        log_metric("gpu_mem_reserve_bytes", mem_reserved, step=epoch)

    log_event("epoch_end", {"epoch": epoch, "loss": loss.item()})

# 4️⃣ Flush any buffered telemetry before exiting
tc.flush()
Key points:
- The
TelemetryClientfrom theazure-applicationinsightsSDK is lightweight and can be used in a single script. - Metrics are sent with an optional
stepproperty so you can drill down per‑epoch or per‑batch. - Flushing at the end guarantees that all telemetry reaches App Insights even if the job crashes.
Advanced Patterns
| Pattern | Description | When to Use |
|---|---|---|
| Custom Events for Data Validation | Log an event when a data loader detects missing or NaN values. | Data‑quality monitoring. |
| Dependency Tracking | Track external calls (e.g., to Azure ML SDK) with tc.track_dependency. |
Diagnose latency in dataset fetches. |
| Batch-Level Metrics | Send loss and accuracy per batch for fine‑grained analysis. | Hyperparameter sweeps or debugging overfitting. |
| Correlation IDs | Generate a UUID at job start and attach to every telemetry item. | Link training logs with downstream inference pipelines. |
Visualizing the Data in App Insights
Once telemetry is flowing, you can create custom dashboards:
- Metrics Explorer: Plot
epoch_lossvs. epoch to spot convergence. - Live Metrics Stream: Monitor
gpu_mem_alloc_bytesin real time during training. - Analytics Queries: Use Kusto Query Language (KQL) to aggregate runtime across all jobs:
customEvents
    | where name == "epoch_end"
    | summarize avg(epoch_runtime_sec), max(epoch_runtime_sec)
      by bin(timestamp, 1h)
Best‑Practice Checklist
- Keep telemetry payload small (<200 bytes) to avoid network overhead.
- Batch metric uploads using
tc.flush()after every N epochs or on shutdown. - Secure the instrumentation key via Azure Key Vault and access policies.
- Tag each job with a unique Run ID to correlate training, validation, and inference stages.
- Set up alerts for abnormal patterns (e.g., loss not decreasing, GPU memory spikes).
By integrating Application Insights into your training pipeline, you gain real‑time visibility, actionable metrics, and a robust audit trail—turning opaque experiments into well‑understood, repeatable processes.
Tracking Key Metrics (Loss, Accuracy, etc.)
In any machine‑learning workflow, the most immediate way to judge whether a model is learning correctly is by monitoring its performance metrics during training. The two most common indicators are **loss** and **accuracy**, but depending on your problem you may also want to keep an eye on precision, recall, F1‑score, ROC‑AUC, or domain‑specific metrics such as BLEU for translation or PSNR for image reconstruction.
Why Continuous Monitoring Matters
- Early detection of overfitting: A rising training loss paired with a plateauing validation accuracy signals that the model is memorising the training data.
- Hyper‑parameter tuning: By visualising how metrics change when you tweak learning rates, batch sizes or regularisation terms, you can quickly converge on the best configuration.
- Debugging pipeline issues: Sudden spikes in loss may indicate corrupted data, numerical instability, or bugs in preprocessing steps.
Setting Up Azure Application Insights for Metric Tracking
Application Insights (App Insights) is a lightweight telemetry service that can ingest custom metrics from any application, including training scripts written in Python, R, Java, or even shell scripts. Below is a step‑by‑step guide to instrument your training loop.
- Create an App Insights resource: In the Azure portal, click +Create a resource → Monitor → Application Insights. Give it a name and select the appropriate region. Once created, copy the
Instrumentation Key. - Install the SDK:
pip install opencensus-ext-azure
pip install opencensus-ext-logging
pip install opencensus-ext-pyflink  # optional, if using Flink
- Initialize the exporter in your training script:
from opencensus.ext.azure.log_exporter import AzureLogHandler
import logging

logging.basicConfig(level=logging.INFO)
logger = logging.getLogger(__name__)
logger.addHandler(AzureLogHandler(connection_string="InstrumentationKey=YOUR_KEY_HERE"))
- Send custom metrics:
def log_metrics(epoch, loss, accuracy): logger.info(f"Epoch:{epoch}", extra={ "custom_dimensions": { "loss": loss, "accuracy": accuracy } })Calllog_metrics()at the end of each epoch or batch. App Insights will surface these as custom events. - Create a dashboard: In Azure Monitor, go to Workbooks → New, and build visualisations that pull from your App Insights resource. Typical widgets:
- Line chart for
lossover epochs. - Scatter plot of
accuracyvs.loss. - Threshold alerts (e.g., send an email if loss > 2.0).
- Line chart for
- Automate alerting: In the App Insights resource, navigate to Alerts → New Alert Rule. Configure a condition such as “Custom metric ‘loss’ greater than 1.5 for 3 consecutive epochs” and set an action group that sends Slack or Teams notifications.
Practical Example: Training a CIFAR‑10 Classifier
import torch
import torch.nn as nn
import torch.optim as optim
from torchvision import datasets, transforms

# Model definition (simple CNN)
class SimpleCNN(nn.Module):
    def __init__(self):
        super().__init__()
        self.conv = nn.Sequential(
            nn.Conv2d(3, 32, 3, padding=1), nn.ReLU(),
            nn.MaxPool2d(2),
            nn.Conv2d(32, 64, 3, padding=1), nn.ReLU(),
            nn.MaxPool2d(2)
        )
        self.fc = nn.Sequential(
            nn.Flatten(),
            nn.Linear(64 * 8 * 8, 256), nn.ReLU(),
            nn.Linear(256, 10)
        )

    def forward(self, x):
        return self.fc(self.conv(x))

# Training loop with metric logging
device = torch.device("cuda" if torch.cuda.is_available() else "cpu")
model = SimpleCNN().to(device)
criterion = nn.CrossEntropyLoss()
optimizer = optim.Adam(model.parameters(), lr=1e-3)

transform = transforms.Compose([transforms.ToTensor()])
train_loader = torch.utils.data.DataLoader(
    datasets.CIFAR10(root='data', train=True, download=True, transform=transform),
    batch_size=64, shuffle=True
)

for epoch in range(1, 21):
    model.train()
    running_loss, correct, total = 0.0, 0, 0
    for images, labels in train_loader:
        images, labels = images.to(device), labels.to(device)
        optimizer.zero_grad()
        outputs = model(images)
        loss = criterion(outputs, labels)
        loss.backward()
        optimizer.step()

        running_loss += loss.item() * images.size(0)
        _, preds = torch.max(outputs, 1)
        correct += (preds == labels).sum().item()
        total += labels.size(0)

    epoch_loss = running_loss / total
    epoch_acc = correct / total
    log_metrics(epoch, epoch_loss, epoch_acc)   # <-- App Insights call
    print(f"Epoch {epoch}: loss={epoch_loss:.4f}, acc={epoch_acc:.4%}")
Extending Beyond Loss and Accuracy
- Per‑class confusion matrix: Log counts of true positives, false positives per class. Useful for imbalanced datasets.
- Resource utilisation metrics: CPU, GPU memory usage can be captured via Azure Monitor’s Metrics Explorer and correlated with training performance.
- Model versioning tags: Attach a tag like
model_version=1.2.3to each metric event so you can compare across releases directly in App
Logging Custom Events and Properties
When you want to track the progress of a training session—whether it’s an online course, a certification exam, or a skill‑building workshop—you can use Azure Application Insights to capture rich telemetry. By logging custom events and properties you gain visibility into user engagement, completion rates, and potential drop‑off points.
Why Log Custom Events?
- Granular insight: Standard metrics (page views, exceptions) are often too coarse for learning analytics.
- Actionable data: Identify which modules cause confusion or which assessments have low scores.
- Performance monitoring: Detect slow content loads that might discourage learners.
Key Custom Events to Capture
| Event Name | Description | Typical Properties |
|---|---|---|
ModuleStarted |
User begins a module. | moduleId, moduleTitle, userId, startTime |
ModuleCompleted |
User finishes a module. | moduleId, duration, score, userId, completionTime |
QuizAttempted |
User attempts a quiz. | quizId, attemptNumber, startTime, userId |
QuizCompleted |
User finishes a quiz. | quizId, score, duration, pass/fail, userId, completionTime |
ResourceAccessed |
User opens supplemental material. | resourceType, resourceId, userId, accessTime |
Implementing Logging in WordPress
You can inject JavaScript into your theme or use a plugin that supports custom tracking. Below is a vanilla JS snippet you might add to the footer of your training pages:
// Ensure Application Insights SDK is loaded
var appInsights = window.appInsights || function(config) {
  // ... (SDK initialization code)
};
appInsights.loadAppInsights();
appInsights.trackPageView(); // Standard page view

// Helper to log custom events
function logTrainingEvent(eventName, properties = {}) {
  appInsights.trackEvent({ name: eventName }, properties);
}

// Example usage when a module starts
document.getElementById('start-module-btn').addEventListener('click', function () {
  const moduleInfo = {
    moduleId: 'mod-101',
    moduleTitle: 'Introduction to PHP',
    userId: window.currentUser.id,
    startTime: new Date().toISOString()
  };
  logTrainingEvent('ModuleStarted', moduleInfo);
});
Practical Advice for Effective Telemetry
- Keep event names consistent: Use camelCase or snake_case across the entire application.
- Limit property cardinality: Avoid storing highly variable strings; instead use identifiers that map to a lookup table in your dashboard.
- Use sampling wisely: For high‑traffic courses, enable adaptive sampling to keep telemetry volume manageable while preserving statistical significance.
- Secure sensitive data: Never log personally identifiable information (PII) unless you have explicit consent and the data is masked or hashed.
- Validate timestamps: Use UTC ISO strings; Application Insights normalizes them for cross‑region analysis.
Analyzing Data in Application Insights
Once events are flowing, you can use the Analytics query editor to answer questions like:
customEvents
| where name == 'ModuleCompleted'
| summarize avg(duration) by moduleId
| order by avg_duration desc
This shows which modules take the longest on average, pointing to potential pacing issues.
Common Pitfalls & How to Avoid Them
- Duplicate events: Ensure idempotent logging by checking if an event has already been sent before re‑sending it during page reloads.
- Missing user context: Always attach a stable user identifier; otherwise, you’ll get fragmented data.
- Overloading the SDK: Batch events when possible to reduce network overhead, especially on mobile devices.
Next Steps
After setting up custom event logging, integrate dashboards in Power BI or Azure Monitor to visualize completion rates and identify bottlenecks. Use alerts for critical drop‑off thresholds (e.g., less than 20% of users completing a module).
Capturing Performance Counters and Resource Usage
When you train deep learning models on Azure Machine Learning or any other cloud platform, the raw metrics—like loss curves and accuracy percentages—are only part of the picture. To truly understand how your training job behaves over time, you need to capture performance counters (CPU, GPU, memory usage) and resource consumption patterns. Azure Application Insights provides a unified telemetry pipeline that lets you ingest, store, and visualize these metrics in real time.
Why Capture Performance Counters?
- Identify Bottlenecks: High GPU memory usage may indicate the need for larger batch sizes or model pruning.
- Cost Management: Spot instances can be terminated; knowing when they are most heavily used helps schedule checkpoints.
- Reliability: Sudden spikes in CPU usage could signal data pipeline failures.
Setting Up Application Insights for ML Training Jobs
-
Create an Application Insights resource:
az monitor app-insights component create \ --app MyTrainingApp \ --location eastus \ --resource-group my-rg -
Instrument your training script:
Add the Azure Monitor SDK and push custom metrics.
from azure.monitor.opentelemetry.exporter import AzureMonitorMetricExporter from opentelemetry.sdk.metrics import MeterProvider, Counter meter = MeterProvider().get_meter("ml-training") exporter = AzureMonitorMetricExporter(connection_string="") counter_gpu_mem = meter.create_counter( "gpu_memory_mb", description="GPU memory usage in MB" ) # Example hook after each training epoch def log_metrics(epoch, gpu_mem): counter_gpu_mem.add(gpu_mem, {"epoch": str(epoch)}) -
Enable Azure Monitor logs for your compute:
If you’re using an Azure ML Compute cluster, enable diagnostic settings to route VM metrics to Application Insights.
az monitor diagnostic-settings create \ --name "VMMetrics" \ --resource "/subscriptions/
/resourceGroups/my-rg/providers/Microsoft.Compute/virtualMachines/my-vm" \ --logs '[{"category":"PerformanceCounters","enabled":true}]' \ --workspace " "
Visualizing Training Progress in Application Insights
After telemetry is flowing, use the Metrics Explorer to build dashboards:
- Loss vs. Epoch: Plot the custom metric “training_loss” over time.
- GPU Memory Heatmap: Use a line chart with time as X-axis and memory usage as Y-axis.
- CPU Utilization Alerts: Create an alert rule that fires if CPU > 90% for more than 5 minutes during training.
Practical Tips & Common Pitfalls
- Use Sampling: If your training runs on many workers, send only a subset of metrics (e.g., every 10th epoch) to avoid exceeding quota.
-
Tag with Context:
Always include tags like
experiment_id,model_version, anddataset_hashso you can filter later. - Check Timezones: Azure metrics are UTC; convert to your local time for dashboards that involve scheduled checkpoints.
- Validate Units: Consistency matters—send GPU memory in MB, CPU usage as a percentage, and loss as a scalar value.
Example: End-to-End Monitoring Pipeline
# training_script.py
import time
from azure.monitor.opentelemetry.exporter import AzureMonitorMetricExporter
from opentelemetry.sdk.metrics import MeterProvider, Counter

meter = MeterProvider().get_meter("ml-training")
exporter = AzureMonitorMetricExporter(connection_string="InstrumentationKey=...")
loss_counter = meter.create_counter(
    "training_loss",
    description="Cross‑entropy loss per epoch"
)
gpu_mem_counter = meter.create_counter(
    "gpu_memory_mb",
    description="GPU memory usage in MB"
)

for epoch in range(1, 51):
    # Simulate training
    time.sleep(2)
    loss = simulate_training_epoch()
    gpu_mem = get_gpu_memory_usage()

    loss_counter.add(loss, {"epoch": str(epoch)})
    gpu_mem_counter.add(gpu_mem, {"epoch": str(epoch)})

# After script finishes, flush telemetry
exporter.shutdown()
By integrating Application Insights into your training workflow, you gain real‑time visibility into both model metrics and the underlying hardware performance. This dual perspective enables proactive scaling decisions, cost optimization, and faster debugging cycles.
Using Telemetry Initializers for Contextual Data
Telemetry initializers are a powerful feature of Azure Application Insights that let you enrich every telemetry item with additional context before it is sent to the ingestion endpoint. This can be invaluable when you want to monitor training progress in machine‑learning workflows, because you can attach metadata such as experiment ID, user ID, or training stage to each log entry.
Why Context Matters for Training Monitoring
- Traceability: When multiple experiments run concurrently, contextual data lets you filter logs by experiment and identify which runs produced a given metric.
- Performance Attribution: By tagging telemetry with the specific training stage (e.g., “data‑prep”, “model‑train”, “evaluation”), you can pinpoint bottlenecks or anomalous behavior in the pipeline.
- Auditability: For regulated industries, storing user or customer identifiers alongside metrics supports compliance audits.
Implementing a Telemetry Initializer in .NET
Below is a minimal example that demonstrates how to create and register a telemetry initializer in a C# application. The initializer adds an “ExperimentId” property to every piece of telemetry.
using Microsoft.ApplicationInsights.Channel;
using Microsoft.ApplicationInsights.Extensibility;

public class ExperimentTelemetryInitializer : ITelemetryInitializer
{
    private readonly string _experimentId;

    public ExperimentTelemetryInitializer(string experimentId)
    {
        _experimentId = experimentId;
    }

    public void Initialize(ITelemetry telemetry)
    {
        // Attach the experiment ID to all telemetry items.
        telemetry.Context.GlobalProperties["ExperimentId"] = _experimentId;

        // Optionally add the current stage if available
        var stage = Environment.GetEnvironmentVariable("TRAINING_STAGE");
        if (!string.IsNullOrEmpty(stage))
        {
            telemetry.Context.GlobalProperties["TrainingStage"] = stage;
        }
    }
}

// Register in your Startup or Program.cs
TelemetryConfiguration configuration = TelemetryConfiguration.CreateDefault();
configuration.InstrumentationKey = "YOUR_INSTRUMENTATION_KEY";
configuration.TelemetryInitializers.Add(new ExperimentTelemetryInitializer("exp-42"));
Registering the Initializer in Python
If you’re using the Azure Monitor SDK for Python, you can achieve similar enrichment by subclassing TelemetryProcessor or adding a custom property during telemetry creation.
from opencensus.ext.azure.log_exporter import AzureLogHandler
import logging

class ExperimentLoggingFilter(logging.Filter):
    def __init__(self, experiment_id):
        super().__init__()
        self.experiment_id = experiment_id

    def filter(self, record):
        record.experiment_id = self.experiment_id
        return True

logger = logging.getLogger(__name__)
handler = AzureLogHandler(connection_string="InstrumentationKey=YOUR_KEY")
handler.addFilter(ExperimentLoggingFilter("exp-42"))
logger.addHandler(handler)
Practical Tips for Effective Telemetry Context
- Keep Properties Consistent: Define a naming convention (e.g.,
ExperimentId,UserId,TrainingStage) and reuse it across all components. - Limit Cardinality: High‑cardinality properties can inflate storage costs. Use short identifiers or hash values when appropriate.
- Avoid Sensitive Data: Never log personally identifiable information unless you have explicit consent and encryption in place.
- Leverage Global Properties: Setting values on
telemetry.Context.GlobalPropertiesensures they propagate to all telemetry types (requests, dependencies, events).
Visualizing Contextual Data in Application Insights
Once enriched, you can filter and group metrics directly in the Azure portal:
- Analytics Query: Use Kusto queries to slice by experiment ID:
traces | where ExperimentId == "exp-42" | summarize avg(duration) by TrainingStage - Charts & Dashboards: Create custom charts that aggregate loss or accuracy per training stage, automatically grouping data by the context properties.
Conclusion
Telemetry initializers are a simple yet powerful way to inject contextual metadata into every telemetry item. When monitoring machine‑learning training pipelines with Application Insights, they enable precise filtering, better diagnostics, and easier compliance—all while keeping your codebase clean and maintainable.
Visualizing Training Progress with Dashboards
Once you have set up Azure Machine Learning (AML) to stream training metrics into Azure Application Insights, the next step is turning those raw telemetry points into actionable insights. A well‑designed dashboard allows data scientists, ML engineers, and business stakeholders to monitor model performance in real time, detect anomalies early, and make informed decisions about retraining or deployment.
Why Dashboards Matter for Training Monitoring
- Real‑time visibility: Spot spikes in loss or drops in accuracy as soon as they happen.
- Historical context: Compare current training runs against previous experiments to gauge improvements.
- Collaboration: Share visual summaries with non‑technical stakeholders without exposing raw logs.
Choosing the Right Dashboard Tool
You can build dashboards in several ways, each with its own trade‑offs:
- Azure Monitor Workbooks: Native to Azure; great for integrating App Insights telemetry and adding custom queries.
- Kusto Query Language (KQL) Dashboards: Use the same language you use in Log Analytics, enabling powerful filtering and aggregation.
- Power BI Embedded: For rich, interactive reports that can be embedded into your internal portal or SharePoint site.
- Grafana + Azure Monitor Data Source: Open‑source, highly customizable; works well if you already use Grafana for other metrics.
Step‑by‑Step: Building an Azure Monitor Workbook
- Create a new workbook: In the Azure portal, navigate to
Azure Monitor > Workbooks > + New. - Add a query block: Select the App Insights resource that receives your training metrics.
- Write a KQL query: For example, to plot loss over time:
traces | where customDimensions.metricName == "train_loss" | order by timestamp asc | project timestamp, value = todouble(customDimensions.metricValue) - Add a line chart: Bind the query output to a line chart visual. Configure X‑axis as
timestampand Y‑axis asvalue. - Repeat for other metrics: Accuracy, validation loss, GPU utilization, etc.
- Add filters: Include dropdowns for experiment name, run ID, or model version so users can slice the data on demand.
- Save and share: Name your workbook (e.g., “ML Training Dashboard”) and set access permissions to relevant team members.
Practical Tips for Effective Dashboards
- Use consistent naming conventions: Prefix all custom dimensions with
ml_(e.g.,ml_train_loss) to avoid confusion. - Normalize timestamps: Store them in UTC; let the dashboard handle time zone conversion for local viewers.
- Set up alerts: In Azure Monitor, create an alert rule that triggers when loss rises above a threshold or accuracy falls below a target. This can auto‑notify your DevOps pipeline to pause training.
- Include metadata panels: Show hyperparameters (learning rate, batch size) and dataset details next to the charts for context.
- Export data periodically: Use Azure Monitor’s export feature or Kusto’s
.exportoperator to store raw telemetry in a blob storage for audit purposes.
Example: A Complete Training Dashboard Layout
Below is a conceptual layout you can replicate using Azure Monitor Workbooks:
- Header: Experiment name, model version, start time.
- Left pane (Filters): Dropdowns for run ID, metric type, date range.
- Main pane:
- Top row: Line charts for training loss and validation loss.
- Middle row: Accuracy curves for training and validation.
- Bottom row: Resource usage (GPU memory, CPU utilization).
- Footer: Summary statistics (mean, min, max) and a link to the underlying logs.
Embedding Dashboards in Your Blog or Portal
If you run an internal blog or knowledge base, consider embedding the workbook directly using the <iframe> tag:
<iframe src="https://portal.azure.com/#blade/Microsoft_Azure_Monitoring/WorkbookViewerBlade/workbookId=YOUR_WORKBOOK_ID"
        width="100%" height="800px" frameborder="0"></iframe>
Replace YOUR_WORKBOOK_ID with the actual workbook ID from the Azure portal URL. This approach gives readers instant access to live training metrics without leaving your site.
Next Steps
- Experiment with Power BI for richer storytelling—add slicers, drill‑through reports, and KPI indicators.
- Automate dashboard updates by linking the workbook to Azure DevOps pipelines that trigger on each new training run.
- Integrate anomaly detection: Use Azure Monitor’s
Anomaly DetectorAPI to automatically flag outliers in loss or accuracy curves.
By combining App Insights telemetry with a thoughtfully designed dashboard, you turn raw training logs into a powerful decision‑making tool—enabling faster iterations, higher model quality, and greater stakeholder confidence.
Alerting and Thresholds for Early Warning
In a production WordPress site, the ability to detect anomalies before they become critical is essential. By setting up intelligent thresholds in Azure Application Insights, you can receive early warnings about performance regressions, error spikes, or unusual traffic patterns that might indicate an underlying issue. Below we walk through practical steps for configuring alerts and illustrate how these can be leveraged to monitor training progress of your application’s learning models via App Insights telemetry.
1. Define Key Metrics
- Page Load Time (Average) – Tracks user experience.
- Error Rate (%) – Detects failures in WordPress plugins or themes.
- CPU/Memory Utilization – Indicates infrastructure strain.
- Custom Telemetry: Model Prediction Accuracy – Captures how well your ML model is performing.
2. Create Thresholds in Application Insights
Use the Azure portal or Kusto queries to define thresholds:
  // Example: Trigger if Avg Page Load > 5 seconds over a 10 minute window
  requests
  | summarize avg(duration) by bin(timestamp, 1m)
  | where avg_duration > 5000
3. Set Up Alert Rules
- Navigate to Azure Monitor → Alerts → New alert rule.
- Select the Application Insights resource.
- Define Condition: Use the Kusto query from step 2 and set the threshold (e.g., > 5 seconds).
- Configure Action Group: Email, SMS, Teams, or webhook to your ops platform.
- Add Alert Details: Name, description, severity level.
4. Example: Early Warning for ML Model Degradation
Suppose you’re training a recommendation model on user interaction data. You want to be notified if the model’s accuracy drops below 85% after a retraining cycle.
  customEvents
  | where name == "ModelAccuracy"
  | summarize latest_accuracy = max(properties.accuracy) by bin(timestamp, 1h)
  | where latest_accuracy < 0.85
Set this query as an alert rule with a short evaluation window (e.g., 15 minutes). When triggered, the notification can include the timestamp and accuracy value so that your data science team can investigate.
5. Best Practices
- Start with Broad Thresholds: Capture a wide range of anomalies, then narrow them as you understand normal behavior.
- Use Adaptive Thresholds: Leverage Azure Monitor’s “adaptive threshold” feature to let the system learn typical patterns and detect deviations.
- Correlate Alerts: Link related alerts (e.g., high CPU + error spike) using tags or custom fields for faster root‑cause analysis.
- Automate Remediation: For predictable issues, trigger Azure Functions that scale resources or restart services automatically.
6. Monitoring Training Progress via App Insights
When training a model on your WordPress site (e.g., for content personalization), you can log training metrics directly to Application Insights:
  var telemetryClient = new TelemetryClient();

  // During training loop
  foreach (var epoch in epochs)
  {
      double loss = TrainOneEpoch(epoch);
      telemetryClient.TrackMetric("TrainingLoss", loss, new Dictionary<string, string>
      {
          {"epoch", epoch.ToString()},
          {"modelVersion", "v2.1"}
      });
  }
These metrics can then be visualized on dashboards and used in alerts to ensure the training pipeline is progressing as expected.
7. Visualizing Alerts
Create a custom dashboard widget:
- Open Azure Monitor → Dashboards.
- Add a new tile.
- Select “Metrics” and configure the query to display alert counts per severity over time.
This real‑time view helps operations teams spot patterns, such as repeated spikes during peak traffic periods, and take proactive measures.
8. Conclusion
By thoughtfully configuring thresholds and alerts in Azure Application Insights, you gain an early warning system that not only protects the stability of your WordPress site but also keeps your data science workflows on track. Remember to iterate on thresholds, incorporate feedback from incidents, and automate remediation where possible for maximum efficiency.
Comparing Multiple Runs and A/B Testing
When you’re experimenting with machine‑learning models or web‑app features, the ability to compare multiple training runs or user journeys side‑by‑side is crucial. Microsoft Azure Application Insights gives you a unified telemetry layer that can capture everything from raw model metrics to end‑user interactions, making it easier to run A/B tests and assess which version truly performs better.
Why Compare Multiple Runs?
- Model stability: See if a new hyperparameter set yields consistent results across several runs.
- Performance drift: Detect when a previously successful model starts to degrade.
- Cost analysis: Evaluate GPU hours or inference latency differences between experiments.
A/B Testing with App Insights
The core idea of A/B testing is to serve two (or more) variants to distinct user cohorts and measure outcomes. With Application Insights you can:
- Tag each request or training job with a custom dimension (e.g.,
ExperimentVariant=ControlorExperimentVariant=Treatment). - Send these tags to App Insights via the SDK or REST API.
- Use Analytics queries to split metrics by variant:
  requests
  | where timestamp > ago(7d)
  | summarize AvgDuration = avg(duration), Count = count() by ExperimentVariant
  | render piechart
This simple query gives you an instant visual comparison of average request latency between the two variants.
Practical Steps to Set Up a Comparison Pipeline
- Create a telemetry context: In your training script or web app, initialize the App Insights client and add custom properties for each run.
- Log metrics per epoch (for ML) or per request (for A/B): Use
trackMetric,trackEvent, ortrackPageViewto capture granular data. - Store run identifiers: Persist a unique
RunIdso you can later filter and aggregate logs by experiment. - Automate queries with Workbooks: Build an Azure Monitor Workbook that pulls the latest runs, applies filters, and displays key metrics (accuracy, loss, latency).
Example: Comparing Two Training Runs
  from azure.monitor.query import MetricsQueryClient
  from azure.identity import DefaultAzureCredential

  client = MetricsQueryClient(DefaultAzureCredential())
  query = """
      customMetrics
      | where name == 'Accuracy'
      | summarize AvgAccuracy=avg(value) by RunId
      | order by AvgAccuracy desc
  """
  result = client.query_workspace(
      workspace_id="YOUR_WORKSPACE_ID",
      query=query,
      timespan=("2025-09-01T00:00:00Z", "2025-09-07T23:59:59Z")
  )
  print(result)
Example: A/B Test for Web Feature Toggle
  const appInsights = window.appInsights;
  // Tag each page view with the current feature flag
  appInsights.trackPageView({
      name: "Home",
      properties: { FeatureFlag: "NewHeader" }
  });
Advanced Tips
- Use Sampling: If telemetry volume is high, enable adaptive sampling to keep response times low without losing trend data.
- Correlate with Log Analytics: Push logs to Azure Log Analytics and run cross‑correlation queries (e.g., correlate CPU usage spikes with model inference latency).
- Set up Alerts: Create metric alerts that trigger when a variant’s performance falls below a threshold, ensuring you can react in real time.
Takeaway
By tagging and logging every run or user interaction in Application Insights, you create a single source of truth for both model training and feature experimentation. This unified view lets you compare multiple runs or A/B test variants with confidence, drive data‑driven decisions, and accelerate your ML and web development lifecycle.
Integrating with CI/CD Pipelines
Once your model training code is ready and your Azure resources are provisioned, the next step is to automate the entire workflow. A well‑structured CI/CD pipeline guarantees that every change—whether it’s a new preprocessing script, a hyperparameter tweak, or an updated Azure ML experiment configuration—is tested, validated, and deployed consistently across environments.
Why CI/CD Matters for Machine Learning
- Reproducibility: Every commit triggers the same training job with identical dependencies.
- Version Control: Model artifacts, code, and configuration files are stored in GitHub or Azure Repos.
- Continuous Monitoring: Training metrics can be automatically logged to Application Insights for real‑time alerts.
Pipeline Overview
The typical ML CI/CD pipeline consists of the following stages:
- Code Commit & Build: Detect changes in the repository and run unit tests on data‑processing scripts.
- Environment Provisioning: Spin up a dedicated Azure ML compute target or use an existing one.
- Training Job Submission: Submit an
Experimentto Azure ML with the latest Docker image. - Metrics Capture: Log training metrics (loss, accuracy, epoch time) to Application Insights via a custom logger.
- Model Registration & Promotion: Register the trained model in the registry and promote it to staging/production based on pre‑defined thresholds.
Practical Example: Azure DevOps YAML Pipeline
trigger:
- main

variables:
  azureSubscription: 'MyAzureConnection'
  resourceGroup: 'ml-rg'
  workspaceName: 'my-ml-workspace'

stages:
- stage: Build
  jobs:
  - job: Test
    pool:
      vmImage: ubuntu-latest
    steps:
    - checkout: self
    - script: |
        python -m venv .venv
        source .venv/bin/activate
        pip install -r requirements.txt
        pytest tests/
      displayName: 'Run unit tests'

- stage: Train
  jobs:
  - job: SubmitTraining
    pool:
      vmImage: ubuntu-latest
    steps:
    - checkout: self
    - task: AzureCLI@2
      inputs:
        azureSubscription: $(azureSubscription)
        scriptType: bash
        scriptLocation: inlineScript
        inlineScript: |
          az ml experiment submit \
            --name train-model \
            --compute-target cpu-cluster \
            --script train.py \
            --resource-group $(resourceGroup) \
            --workspace-name $(workspaceName) \
            --outputs output=output_path
      displayName: 'Submit training job'
Logging Training Metrics to Application Insights
Integrating Azure ML with Application Insights allows you to view live dashboards, set up alerts, and correlate metrics across services.
Step‑by‑step Integration
- Create an Application Insights resource: In the Azure portal, add a new App Insights instance.
- Install the SDK in your training script:
from azure.applicationinsights import TelemetryClient

# Replace with your instrumentation key
ai_key = "YOUR_INSTRUMENTATION_KEY"
tc = TelemetryClient(ai_key)

def log_metric(name, value):
    tc.track_metric(name=name, value=value)
tc.flush() # Ensure the data is sent immediately- Instrument training loop:
for epoch in range(num_epochs):
    train_loss = run_epoch(...)
    val_accuracy = validate(...)

    # Log metrics
    log_metric("train_loss", float(train_loss))
    log_metric("val_accuracy", float(val_accuracy))
    log_metric("epoch_time_sec", time_elapsed)
Benefits
- Real‑time Dashboards: View loss curves and accuracy directly in the Azure portal.
- Alerting: Configure alerts for metrics that exceed thresholds (e.g., training loss not decreasing).
- Correlation IDs: Attach a unique run ID to each metric so you can trace back to the corresponding experiment run.
Advanced Tips
- Use Azure ML SDK’s
Run.log()with Application Insights: The SDK can automatically forward metrics to App Insights if you configure the logger once. - Containerize the training script: Build a Docker image that includes the AI SDK and push it to ACR. Then reference this image in your pipeline for reproducibility.
- Parallel Training Jobs: Leverage Azure ML’s parallel processing capabilities, and log aggregated metrics per batch for better visibility.
Sample Dashboard View
After a training run completes, navigate to the Application Insights resource,
open the “Metrics” pane, and select the custom metric names you logged (e.g.,
train_loss, val_accuracy). You can overlay multiple metrics on a single chart or create separate panels for each.
Conclusion
By embedding your training workflow into an automated CI/CD pipeline and leveraging Application Insights for monitoring, you gain full observability, faster iteration cycles, and the confidence that every model artifact is reproducible and auditable. This end‑to‑end automation is essential for production‑grade machine learning systems.
Security, Privacy, and Data Governance Considerations
When you use Azure Application Insights to monitor the progress of a machine‑learning or deep‑learning training job, you are collecting telemetry that can include sensitive information about your data pipeline, model architecture, and even partial model weights if you log them explicitly. Below is a practical guide on how to keep this telemetry compliant with security best practices, privacy regulations (GDPR, CCPA, HIPAA), and internal data‑governance policies.
1. Identify Sensitive Data in Telemetry
- Model Parameters & Weights: Do not log raw weights or embeddings unless they are already anonymized.
- Training Input Samples: Logs that contain image bytes, audio waveforms, or text can expose personal data.
- User IDs / Session IDs: These should be hashed or removed before sending to App Insights.
2. Use Custom Telemetry Initializers
Implement a telemetry initializer in your training script that scrubs or masks sensitive fields automatically.
from opencensus.ext.azure.log_exporter import AzureLogHandler
import hashlib

class MaskingTelemetryInitializer:
    def __init__(self, instrumentation_key):
        self.handler = AzureLogHandler(connection_string=f"InstrumentationKey={instrumentation_key}")

    def process(self, record):
        # Hash any user identifiers
        if hasattr(record, 'user_id'):
            record.user_id = hashlib.sha256(str(record.user_id).encode()).hexdigest()
        # Remove raw data payloads
        for field in ['image_bytes', 'audio_samples', 'raw_text']:
            if hasattr(record, field):
                delattr(record, field)
        return record

# Attach to logger
logger.addHandler(MaskingTelemetryInitializer("YOUR_INSTRUMENTATION_KEY"))
3. Configure Sampling and Retention Policies
- Sampling: Reduce the volume of telemetry by enabling adaptive sampling (default 5% for App Insights). This limits exposure while still capturing trends.
- Retention: Use Azure Monitor’s data retention settings to keep logs only as long as required by your compliance policy (e.g., 90 days).
4. Secure Transmission and Storage
- Transport Security: App Insights automatically uses HTTPS; verify that the endpoint is reachable over TLS 1.2 or higher.
- Encryption at Rest: Data in Azure Monitor is encrypted by default using Microsoft-managed keys. If you require customer‑managed keys, enable Azure Key Vault integration.
- Access Controls: Use Azure RBAC to restrict who can view or query telemetry. Grant read access only to the operations team, and write access to the training pipeline service principal.
5. Auditing and Alerting for Policy Violations
Create an App Insights alert that fires when a log contains prohibited content (e.g., raw image bytes).
{
  "name": "SuspiciousTelemetryAlert",
  "condition": {
      "allOf": [
          { "field": "customDimensions.image_bytes", "operator": "exists" }
      ]
  },
  "actionGroup": ["SecurityTeam"],
  "description": "Alert when raw image data is logged to App Insights"
}
6. Documentation and Training
- Maintain a Telemetry Data Glossary that lists all telemetry properties, their sensitivity level, and handling rules.
- Run quarterly workshops for data scientists to review the latest privacy guidelines and how they map onto App Insights instrumentation.
7. Example: End‑to‑End Workflow
- Data Ingestion: Raw training images are stored in an Azure Blob container with a private access tier.
- Preprocessing Script: Logs only the count of processed samples and the hash of each image file name.
- Training Loop: Emits custom events for epoch completion, loss metrics, and validation accuracy. All events are sent through a sanitized telemetry pipeline that removes raw pixel data.
- Post‑Training: Aggregated results are stored in Azure Table Storage; App Insights only receives summary statistics.
By combining careful telemetry design, secure transmission, strict access control, and continuous monitoring for policy violations, you can confidently use Application Insights to track training progress while staying compliant with security, privacy, and data‑governance requirements.
Conclusion
Once your machine‑learning model is live, the real challenge shifts from training to monitoring. Application Insights (App Insights) provides a lightweight, cloud‑agnostic way to track how well your model performs in production and to surface anomalies before they become critical.
Why App Insights for Model Monitoring?
- Real‑time telemetry: Capture predictions, confidence scores, latency, and error rates on the fly.
- Custom metrics & events: Define domain‑specific KPIs such as “recall per class” or “false positive rate.”
- Alerting & dashboards: Set thresholds that trigger alerts via email, Teams, or PagerDuty.
- Integration with CI/CD: Embed telemetry in deployment pipelines to validate each rollout.
Step‑by‑step Integration Guide
- Install the SDK
pip install opencensus-ext-azure
pip install azure-appinsights
- Configure App Insights key
from opencensus.ext.azure.log_exporter import AzureLogHandler

handler = AzureLogHandler(connection_string='InstrumentationKey=YOUR_KEY')
logger.addHandler(handler)
- Emit custom metrics in your inference code
from opencensus.stats import stats from opencensus.stats.measure import MeasureDouble from opencensus.stats.view import View, ViewData # Define a measure for prediction latency m_latency = MeasureDouble('prediction.latency', 'Latency of model inference', 'ms') # Register a view to aggregate by label (e.g., model version) view = View(name='latency_by_version', description='Inference latency per model version', columns=['model_version'], measure=m_latency, aggregation=stats.AggregationCount()) stats.register_view(view) # In your inference loop import time start = time.time() prediction = model.predict(input_data) end = time.time() stats.record([(m_latency, (end - start) * 1000)], ['v1']) - Track prediction confidence and error rates
logger.info('prediction', extra={ 'confidence': pred_confidence, 'label': predicted_label, 'true_label': true_label }) - Create dashboards in the Azure portal
- Navigate to App Insights → Metrics.
- Select your custom metrics (e.g.,
prediction.latency) and group by labels likemodel_version. - Pin the widgets to a shared dashboard for quick visual checks.
- Set up alerts
{
  "name": "High Latency Alert",
  "condition": {
    "odata.type": "#Microsoft.Azure.Monitor.SingleResourceMultipleMetricCriteria",
    "allOf": [{
      "metricName": "prediction.latency",
      "operator": "GreaterThan",
      "threshold": 500,
      "timeAggregation": "Average"
    }]
  },
  "actionGroups": ["MyAlertGroup"]
}
Practical Tips
- Label everything: Use consistent labels (e.g.,
model_version,environment) to slice data later. - Sample wisely: If traffic is high, sample a percentage of requests to keep ingestion costs low.
- Correlate logs and metrics: Store request IDs in both logs and metrics so you can trace a single inference end‑to‑end.
- Version control your telemetry schema: Treat metric definitions like code; update them with new model releases.
Common Pitfalls to Avoid
- Over‑instrumenting: Too many metrics can overwhelm dashboards and inflate costs.
- Missing error handling: If your inference code crashes before sending telemetry, you lose valuable data.
- Ignoring cold starts: For serverless deployments, monitor startup latency separately from inference latency.
By weaving Application Insights into the fabric of your ML deployment, you gain a single pane of glass that shows not just whether your model is answering questions correctly, but how quickly it does so, how stable it remains over time, and when something goes wrong. Start small—instrument latency and error rates—and iterate to add richer metrics as your production pipeline matures.
FAQ
When you expose your machine‑learning model through a REST API or an Azure Function, the next logical step is to keep an eye on how it behaves in production. Azure Application Insights (AI) gives you a single pane of glass for performance metrics, request logs, and custom telemetry that lets you track the health of your inference pipeline in real time.
Why Use Application Insights?
- Real‑time monitoring – instantly see latency spikes or error rates.
- Custom metrics – log anything from prediction confidence to input size.
- Alerting & dashboards – set up thresholds that trigger email/SMS alerts.
- Integrated diagnostics – correlate requests with logs and traces for deeper troubleshooting.
Step‑by‑Step Integration Guide
-
Create an Application Insights resource
In the Azure portal, add a new
Application Insightsresource. Note the Instrumentation Key – you’ll need it in your code. -
Add the SDK to your inference service
using Microsoft.ApplicationInsights; using Microsoft.ApplicationInsights.Extensibility; // In Startup.cs or Program.cs var telemetryConfiguration = TelemetryConfiguration.CreateDefault(); telemetryConfiguration.InstrumentationKey = "YOUR_INSTRUMENTATION_KEY"; var telemetryClient = new TelemetryClient(telemetryConfiguration); -
Log request metrics
Wrap your prediction handler to capture latency and success/failure.
public async TaskPredictAsync([FromBody] InputData input) { var start = DateTime.UtcNow; try { var result = await _model.PredictAsync(input); telemetryClient.TrackEvent("PredictionSuccess", new Dictionary<string, string>() { {"ModelVersion", "v1.2"}, {"InputSize", input.Data.Length.ToString()} }); return Ok(result); } catch (Exception ex) { telemetryClient.TrackException(ex); throw; } finally { var duration = DateTime.UtcNow - start; telemetryClient.GetMetric("PredictionLatencyMs").TrackValue(duration.TotalMilliseconds); } } -
Custom dimensions for training progress
If you re‑train the model periodically, log a custom event each time you finish an epoch.
telemetryClient.TrackEvent("TrainingEpochComplete", new Dictionary<string, string>() { {"Epoch", epochNumber.ToString()}, {"Loss", lossValue.ToString()}, {"Accuracy", accuracy.ToString()} }); -
Set up alerts
In the AI resource, go to Alerts > New alert rule. For example:
- Condition: Metric “PredictionLatencyMs” > 500 ms for 5 consecutive minutes.
- Action group: Email to [email protected].
-
Create dashboards
Use the Analytics query language (Kusto) to build custom charts:
requests
| where cloud_RoleName == "InferenceService"
| summarize avg(duration) by bin(timestamp, 1m)
| render timechart
Practical Tips & Common Pitfalls
- Keep the SDK lightweight – use asynchronous tracking or batch uploads to avoid adding latency.
- Mask sensitive data – never log raw user inputs; hash or truncate before sending.
- Version your metrics – add a “ModelVersion” dimension so you can compare performance across iterations.
- Use sampling for high‑traffic services – Application Insights supports adaptive sampling to reduce cost while preserving trends.
- Validate in staging first – ensure your telemetry doesn’t interfere with production traffic before full rollout.
Real‑world Example: Detecting Drift Early
Suppose you notice the average prediction latency has jumped from 120 ms to 450 ms overnight. By correlating this spike with a custom event “TrainingEpochComplete” that logged a sudden drop in accuracy, you can infer that a recent retrain introduced numerical instability.
- Action taken: Roll back to the previous model version and schedule a new training run with adjusted hyperparameters.
- Result: Latency returned to baseline within minutes, and accuracy improved by 2 % on the validation set.
By weaving Application Insights into every stage—from inference requests to training cycles—you gain end‑to‑end visibility that turns raw data into actionable intelligence. This proactive monitoring not only keeps your service reliable but also accelerates model improvement cycles.
Categories
- AI & Enrichment Play
- Broiler Farming
- Broiler Farming Tips
- Canine Wellness & Longevity
- Cat
- Cat & Human Connection
- Cat Adoption & Rescue
- Cat Breeds
- Cat Breeds & Personalities
- Cat Care & Health
- Cat Grooming & Hygiene
- Cat Lifestyle & Environment
- Cat Myths & History
- Cat Nutrition & Diet
- Cat Products & Reviews
- Cat Training & Behavior
- Comparison
- Consumer Awareness
- Dog
- Dog Accessories & Products
- Dog Adoption & Rescue
- Dog Breed & Lifestyle Trends
- Dog Breeding & Puppies
- Dog Entertainment & Media
- Dog Fashion & Trends
- Dog Fun & Lifestyle
- Dog Grooming & Hygiene
- Dog History & Culture
- Dog Myths, Science & Future Tech
- Dog News & Trends
- Dog Nutrition & Food
- Dog Psychology & Emotions
- Dog Safety & Security
- Dog Sports & Activities
- Dog Technology & Innovation
- Dog Training for Modern Owners
- Dog Travel & Adventure
- Dog Travel, Adventure & Culture
- Economic and Market Insights
- Educational Content
- FAQs
- Feeding Alternatives
- Festivals & Seasonal Ideas
- Fun & Entertainment
- General Knowledge
- General Pig Farming
- Health & Disease Management
- Housing and Environment
- Kittens
- Market Insights
- Miscellaneous
- Miscellaneous
- Motivational
- pig
- Pig Breeding
- Pig Breeds
- Pig Farming Stories and Inspiration
- Pig Health and Care
- Pig Nutrition
- Pig Products
- Profitability & Business
- Puppy Care
- Puppy Predictable Topics Reinvented
- Regional Focus
- Rescue & Adoption Buzz
- Senior Cats
- Senior Dog Care
- Smart Dog Tech & Gadgets
- Sustainability
- Sustainable & Eco-Friendly Dog Products
- Tech & Innovations
- Working & Service Dogs
- Broiler Feed66 products
- Country Feed33 products
- Pig Feed66 products
- Product22 products
- Raw Materials99 products
Products
-
 Fish Meal
₹1,999.00 – ₹2,999.00Price range: ₹1,999.00 through ₹2,999.00Rated 0 out of 5
Fish Meal
₹1,999.00 – ₹2,999.00Price range: ₹1,999.00 through ₹2,999.00Rated 0 out of 5 -
 FATTENING BROILER FEED
₹2,299.00 – ₹2,349.00Price range: ₹2,299.00 through ₹2,349.00Rated 0 out of 5
FATTENING BROILER FEED
₹2,299.00 – ₹2,349.00Price range: ₹2,299.00 through ₹2,349.00Rated 0 out of 5 -
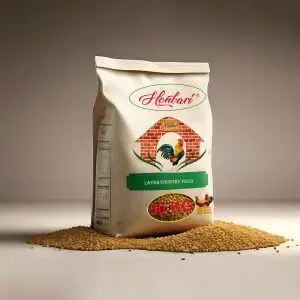 LAYER COUNTRY FEED
₹1,549.00 – ₹1,649.00Price range: ₹1,549.00 through ₹1,649.00Rated 0 out of 5
LAYER COUNTRY FEED
₹1,549.00 – ₹1,649.00Price range: ₹1,549.00 through ₹1,649.00Rated 0 out of 5 -
 COUNTER BROILER FEED
₹1,199.00 – ₹1,299.00Price range: ₹1,199.00 through ₹1,299.00Rated 0 out of 5
COUNTER BROILER FEED
₹1,199.00 – ₹1,299.00Price range: ₹1,199.00 through ₹1,299.00Rated 0 out of 5 -
 LACTATING PIG FEED
Rated 0 out of 5
LACTATING PIG FEED
Rated 0 out of 5₹2,299.00Original price was: ₹2,299.00.₹1,740.00Current price is: ₹1,740.00. -
 Maize
Rated 0 out of 5
Maize
Rated 0 out of 5₹1,650.00Original price was: ₹1,650.00.₹1,300.00Current price is: ₹1,300.00. -
 GESTATION PIG FEED (Phase 1)
Rated 0 out of 5
GESTATION PIG FEED (Phase 1)
Rated 0 out of 5₹2,249.00Original price was: ₹2,249.00.₹1,699.00Current price is: ₹1,699.00. -
 Pre Starter Broiler Feed
₹2,399.00 – ₹2,499.00Price range: ₹2,399.00 through ₹2,499.00Rated 0 out of 5
Pre Starter Broiler Feed
₹2,399.00 – ₹2,499.00Price range: ₹2,399.00 through ₹2,499.00Rated 0 out of 5 -
 FINISHER PIG FEED
Rated 0 out of 5
FINISHER PIG FEED
Rated 0 out of 5₹2,299.00Original price was: ₹2,299.00.₹1,749.00Current price is: ₹1,749.00. -
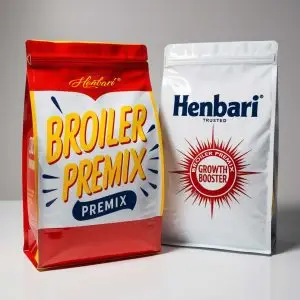 Broiler Premix
Rated 0 out of 5
Broiler Premix
Rated 0 out of 5₹820.00Original price was: ₹820.00.₹699.00Current price is: ₹699.00.