
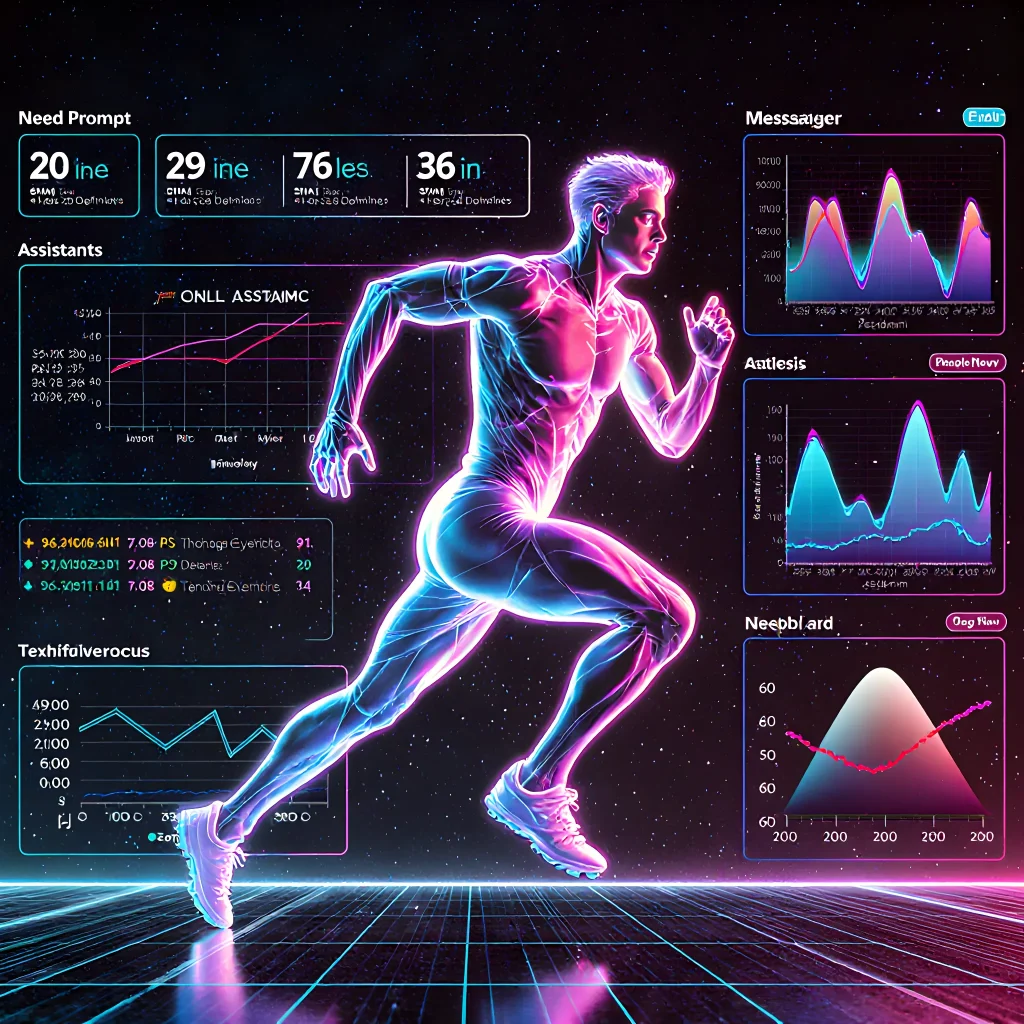
Elevate Your Game—Metrics That Matter
Unlock Peak Performance, One Smart Metric at a Time
Table of Contents
- Introduction to Wearable Data
- Types of Wearable Devices Used in Training
- Key Metrics Captured by Wearables
- Data Collection Best Practices
- Integrating Wearable Data into Coaching Workflows
- Personalized Training Adjustments
- Monitoring Recovery and Preventing Injury
- Real‑Time Feedback During Sessions
- Post‑Session Analysis for Performance Gains
- Data Privacy and Ethical Considerations
- Challenges in Data Interpretation
- Future Trends in Wearable Technology
- Case Studies: Success Stories
- Conclusion
- FAQ
Introduction to Wearable Data
Wearables have evolved from simple step counters to sophisticated sensors that capture a wide range of physiological and biomechanical data in real time. When integrated into training programs, this data can transform an ordinary workout into a highly personalized, efficient, and safe experience.
1. Real‑Time Performance Feedback
- Heart Rate Zones: Devices like the Polar Vantage or Garmin Fenix display instantaneous heart rate, allowing athletes to stay within target zones (e.g., aerobic vs anaerobic). Coaches can instantly adjust intensity based on live feedback.
- Power Output: For cyclists and runners, power meters provide wattage data. Trainers use this metric to design interval sessions that hit specific lactate thresholds.
- Motion Capture: Inertial Measurement Units (IMUs) track joint angles and acceleration. Coaches can spot improper form during a squat or deadlift and correct it on the spot, reducing injury risk.
2. Objective Progress Tracking
Subjective feelings (“I feel good”) are notoriously unreliable. Wearables supply concrete numbers:
- Sleep Quality & Recovery: Sleep trackers reveal REM cycles and disturbances, informing rest day decisions.
- Training Load Index: Calculated from session duration, intensity, and heart rate variability (HRV), this index helps prevent overtraining by flagging when accumulated load exceeds recovery capacity.
3. Personalized Coaching Plans
Data analytics platforms (e.g., TrainingPeaks, Strava Analytics) aggregate wearable data across seasons. Coaches can identify patterns such as:
- Consistent dips in HRV during a particular week—suggesting the athlete needs more recovery.
- Higher-than-average power output on downhill runs—indicating potential for speed work.
These insights enable coaches to craft individualized workouts, rather than relying solely on generic templates.
4. Injury Prevention & Rehabilitation
- Load Management: Sudden spikes in training load are flagged early, allowing for tapering before injuries develop.
- Movement Symmetry: Wearables detect asymmetries (e.g., one knee bearing more load). Early detection leads to targeted corrective exercises.
5. Motivation & Accountability
Visual dashboards and gamified goals keep athletes engaged. When a runner sees that they are 10% closer to their weekly mileage goal, the psychological boost can be significant. Coaches can set up leaderboards or share progress reports via email or messaging apps.
Practical Implementation Tips
- Select the Right Sensors: Match device capabilities with training goals (e.g., HRV monitors for endurance, power meters for strength).
- Integrate Data Platforms: Use APIs to sync data into a central dashboard. Tools like Zwift or TrainerRoad can automatically import wearables data.
- Educate Athletes: Provide short tutorials on interpreting graphs (e.g., what does a high HRV mean?).
- Set Threshold Alerts: Configure notifications for when heart rate exceeds a limit or HRV drops below baseline.
- Review Regularly: Schedule weekly data reviews to adjust training loads and goals.
By harnessing wearable data, coaches can shift from intuition‑driven decisions to evidence‑based strategies that enhance performance, reduce injury risk, and keep athletes motivated throughout their training journey.
Types of Wearable Devices Used in Training
Wearables have evolved from simple pedometers to sophisticated multi‑sensor platforms that can capture a wide array of physiological and biomechanical data. Below is a comprehensive list of the most commonly used wearables in sports, fitness, and rehabilitation training, along with practical examples of how each device can be leveraged to enhance training sessions.
1. Smartwatches & Fitness Bands
- Examples: Apple Watch Series 10, Garmin Fenix 7, Fitbit Charge 6
- Key Sensors: GPS, heart‑rate monitor (HRM), accelerometer, gyroscope, skin temperature sensor.
- Practical Use:
- Track distance and pace during outdoor runs or cycling sessions.
- Monitor HR zones to ensure athletes stay within prescribed intensity ranges.
- Use built‑in sleep tracking to assess recovery quality between training blocks.
2. Chest Strap Heart Rate Monitors
- Examples: Polar H10, Garmin HRM-Dual, Wahoo Tickr X
- Key Sensors: Electrocardiogram (ECG) for highly accurate heart rate.
- Practical Use:
- Provide real‑time HR feedback during high‑intensity interval training (HIIT).
- Collect minute‑by‑minute HRV data to fine‑tune tapering schedules.
- Integrate with power meters for mixed‑mode analyses (HR vs. power).
3. Power Meters
- Examples: Stryd, Garmin Vector, Favero Assioma
- Key Sensors: Strain gauges that measure torque and cadence.
- Practical Use:
- Quantify work output in watts during cycling or rowing sessions.
- Identify power asymmetries between legs to guide corrective drills.
- Couple with HR data for training load calculations (e.g., TRIMP).
4. GPS Trackers & Smart Helmets
- Examples: Garmin Forerunner 945, Wahoo ELEMNT BOLT, Fox Pro Helix Headlamp
- Key Sensors: High‑precision GPS, barometric altimeter.
- Practical Use:
- Map course profiles to design altitude‑specific workouts.
- Validate pacing strategies by comparing planned vs. actual splits.
- Use real‑time navigation to keep athletes on optimal routes during long‑distance events.
5. Inertial Measurement Units (IMUs)
- Examples: Catapult S5, Zephyr IMU, Xsens MVN
- Key Sensors: Accelerometer, gyroscope, magnetometer.
- Practical Use:
- Analyze joint kinematics (hip, knee, ankle) during sprinting or jumping drills.
- Detect asymmetries in movement patterns that may predispose to injury.
- Provide objective metrics for technique coaching (e.g., stride length consistency).
6. Biomechanical Wearables
- Examples: Hexoskin Smart Shirt, Athletico Sensor Footwear.
- Key Sensors: Respiratory bands, EMG electrodes, pressure sensors.
- Practical Use:
- Measure breathing patterns to optimize aerobic capacity training.
- Track muscle activation for neuromuscular fatigue assessment.
- Evaluate foot strike mechanics in runners to reduce impact forces.
7. Smart Insoles & Footwear
- Examples: Oura Ring, Nike Adapt BB, Sole Support Insole System.
- Key Sensors: Pressure sensors, accelerometers.
- Practical Use:
- Monitor plantar pressure distribution during gait analysis.
- Identify load imbalances that could lead to overuse injuries.
- Provide real‑time feedback for corrective footwork drills.
8. Virtual Reality & Augmented Reality Headsets
- Examples: Oculus Quest 2, Microsoft HoloLens, HTC Vive Pro.
- Key Sensors: Inside‑out tracking cameras, inertial sensors.
- Practical Use:
- Create immersive scenario training (e.g., obstacle courses, tactical drills).
- Simulate game situations to improve decision‑making under pressure.
- Integrate motion capture data for precise movement analysis.
9. Wearable Cameras & Action Cam Units
- Examples: GoPro HERO11, DJI Osmo Action, Sony RX0 II.
- Key Sensors: High‑speed video capture, optical stabilization.
- Practical Use:
- Record training sessions for visual feedback and technique review.
- Analyze body mechanics from
Key Metrics Captured by Wearables
Wearable devices have become indispensable tools for athletes and coaches looking to fine‑tune training sessions. By continuously collecting physiological, biomechanical, and environmental data, wearables provide a granular view of performance that was previously impossible to achieve in real time. Below is a detailed breakdown of the most impactful metrics, how they’re measured, and practical ways to use them during training.
1. Heart Rate (HR) & Heart Rate Variability (HRV)
- What it tells you: HR gives an immediate snapshot of cardiovascular load, while HRV reflects autonomic nervous system balance and recovery status.
- Measurement: Optical photoplethysmography or ECG sensors embedded in smartwatches or chest straps.
- Practical use:
- Training zones: Use HR to keep workouts within specific intensity zones (e.g., 70‑80% VO₂max for tempo runs).
- Recovery monitoring: Track daily HRV trends; a sudden drop may signal overtraining, prompting lighter sessions or additional rest.
2. Power Output (Watts)
- What it tells you: Direct measure of effort for cycling, rowing, and running with power meters.
- Measurement: Built‑in sensors on bikes or handheld devices that calculate force × velocity.
- Practical use:
- Threshold identification: Determine functional threshold power (FTP) to structure interval training.
- Real‑time pacing: Adjust effort on the fly based on wattage feedback, especially during hill repeats or time trials.
3. GPS & Cadence
- What it tells you: Route accuracy, speed, distance, and pedaling rhythm.
- Measurement: Satellite navigation combined with accelerometers for cadence.
- Practical use:
- Terrain analysis: Correlate elevation changes with power or HR to identify efficient climbing strategies.
- Cadence control: Maintain optimal pedaling rate (e.g., 90–100 rpm for endurance rides) to reduce injury risk.
4. Accelerometry & Gyroscope Data
- What it tells you: Movement patterns, impact forces, and joint loading.
- Measurement: 3‑axis accelerometers and gyroscopes inside the wearable.
- Practical use:
- Technique analysis: Detect asymmetries in stride or swing, informing biomechanical coaching.
- Injury prevention: Flag abnormal impact peaks that may precede stress fractures or tendinopathies.
5. Oxygen Saturation (SpO₂) & Respiratory Rate
- What it tells you: Efficiency of oxygen delivery and breathing patterns during exertion.
- Measurement: Pulse oximeters on the wrist or finger, combined with respiratory sensors.
- Practical use:
- Altitude adaptation: Monitor SpO₂ to gauge acclimatization during high‑altitude training camps.
- Breathing drills: Use respiratory rate data to refine breathing techniques for endurance sports.
6. Temperature & Sweat Rate
- What it tells you: Core and skin temperature, hydration status.
- Measurement: Thermistors or infrared sensors; sweat rate inferred from weight loss and humidity data.
- Practical use:
- Heat acclimation: Adjust training intensity in hot environments based on rising core temperature.
- Hydration strategy: Use sweat rate to personalize fluid replacement plans during long sessions.
7. Sleep Quality & Recovery Metrics
- What it tells you: Sleep stages, disturbances, and overall recovery capacity.
- Measurement: Accelerometers and heart rate monitoring during sleep cycles.
- Practical use:
- Training load adjustment: Scale training intensity on days following poor sleep or high REM fragmentation.
- Recovery programs: Integrate active recovery or rest days when slow recovery trends are detected.
Integrating Wearable Data into Training Plans
- Set clear objectives: Decide whether you’re focusing on endurance, strength, speed, or recovery.
- Collect baseline data: Run a week of “normal” training to establish personal metrics for each parameter.
- Create thresholds: Use the baseline to define HR zones, power targets, and acceptable ranges for temperature and sleep.
- Plan with context: Design workouts that target specific metrics (e.g., high‑intensity intervals to improve VO₂max, tempo runs for lactate threshold).
- Review & adjust: After each training block, analyze trends and tweak intensity or volume accordingly.
By harnessing these metrics, athletes can transition from guess‑work to data‑driven decisions, ensuring that every training session is purposeful, efficient,
Data Collection Best Practices
When integrating wearable data into training sessions, the quality of your insights hinges on how you gather and manage that data. Below are actionable guidelines to ensure you collect reliable, ethical, and useful information.
1. Define Clear Objectives Before You Start
- Performance Goals: Are you tracking improvements in sprint speed, recovery time, or endurance? Specify the metrics that directly tie to your training objectives.
- Health Monitoring: If you aim to prevent injury, focus on variables such as heart‑rate variability (HRV), sleep quality, and movement asymmetry.
2. Choose the Right Wearables for Your Needs
Not all wearables are created equal. Match device capabilities to your data requirements:
| Device Type | Key Metrics | Best Use Case |
|---|---|---|
| Smartwatch (e.g., Apple Watch, Garmin) | HR, steps, VO₂ max estimate, sleep stages | General fitness tracking and recovery monitoring |
| Chest Strap HR Monitor | Accurate heart‑rate data (±1 bpm) | High‑intensity interval training, endurance sessions |
| GPS Running Watch | Distance, pace, elevation gain | Outdoor running and cycling workouts |
| Inertial Measurement Unit (IMU) | Acceleration, joint angles, stride length | Biomechanics analysis and technique refinement |
3. Standardize Data Collection Protocols
- Calibration: Perform a quick calibration before each session (e.g., HR monitor fit, GPS warm‑up).
- Consistent Placement: Keep wearables in the same spot each time to avoid sensor drift.
- Synchronized Timing: Use a common clock or timestamp across devices so you can align data streams accurately.
4. Automate Data Syncing and Backup
Manual uploads are error‑prone. Set up automated sync via cloud services (e.g., Garmin Connect, Strava API) or use a dedicated app that aggregates multiple devices into one dashboard.
Example Workflow:
  1. Athlete completes session wearing GPS watch + HR strap.
  2. Devices automatically sync to the cloud at 9 PM local time.
  3. Data is pulled via API into a secure database.
  4. Backup script runs nightly, storing data on an encrypted external drive.
5. Ensure Data Quality and Integrity
- Data Validation: Check for outliers (e.g., sudden HR spikes that exceed physiological limits). Flag or remove anomalies.
- Missing Data Handling: Use interpolation or imputation methods only when justified; otherwise, document gaps clearly.
- Version Control: Keep track of firmware updates on devices as they can change data interpretation.
6. Protect Athlete Privacy and Consent
Wearable data is sensitive personal information. Follow these steps:
- Informed Consent: Provide a clear privacy statement outlining what data will be collected, how it will be used, and who can access it.
- Data Minimization: Collect only the metrics that directly support training goals.
- Secure Storage: Encrypt databases at rest and in transit. Use role‑based access controls to limit who sees raw data.
7. Leverage Data Analytics for Actionable Insights
Raw numbers become valuable only when interpreted correctly. Here are practical ways to translate wearable data into training decisions:
- Trend Analysis: Plot HRV over weeks to spot fatigue buildup.
- Threshold Mapping: Define intensity zones (e.g., Zone 2: 60–70% HRmax) and track time spent in each zone.
- Recovery Recommendations: If sleep efficiency drops below 85%, suggest a lighter session or active recovery.
8. Continuously Review and Refine Your Data Strategy
The field of sports analytics evolves rapidly. Schedule quarterly reviews to assess:
- Device accuracy (compare with lab equipment if possible)
- Data pipeline robustness (error logs, sync failures)
- Coaching outcomes (has data-driven feedback improved performance?)
Practical Example: Improving a Sprinter’s Acceleration Phase
- Collect: Use an IMU on the athlete’s lower back to capture acceleration and joint angles during starts.
- Analyze: Identify deviations from the ideal launch angle (>30°) or inconsistent force application.
- Coach Feedback: Provide video overlay with real‑time metrics, highlighting when the athlete’s hips were too low.
- Track Progress: After a 4‑week intervention, compare IMU data to baseline; expect increased average acceleration and reduced start time.
By following these best practices, you’ll ensure that wearable data becomes a reliable partner in designing smarter, safer, and more effective training sessions.
Integrating Wearable Data into Coaching Workflows
Modern wearables have turned raw physiological data into actionable insights that can transform every aspect of a coaching session. By embedding these metrics into your routine, you gain a real‑time, evidence‑based foundation for decision making.
1. Pre‑Session Planning
- Load Assessment: Use heart rate variability (HRV) and resting HR to gauge readiness. A low HRV may signal fatigue; adjust volume or intensity accordingly.
- Recovery Tracking: Monitor sleep duration, quality, and movement during rest days. If a player consistently sleeps <6 hrs, consider adding active recovery or reducing workload.
2. Real‑Time Session Management
- Intensity Monitoring: Continuous HR zones let you verify that athletes stay within prescribed effort levels during drills.
- Movement Analysis: GPS and inertial measurement units (IMUs) provide velocity, acceleration, and deceleration data. Spot spikes in peak acceleration to spot potential injury risk.
3. Post‑Session Evaluation
- Performance Metrics: Compare session distance, speed, or power output against baseline charts to assess progress.
- Feedback Loop: Share data visualizations with athletes. Seeing their own stats fosters ownership and motivation.
4. Long‑Term Development
Aggregate weekly or monthly trends reveal adaptation patterns. For instance, a gradual increase in average power output over six weeks indicates positive training stimulus.
5. Practical Integration Tips
- Select the Right Devices: Choose wearables that align with your sport’s demands (e.g., GPS for soccer, HR monitors for endurance).
- Standardize Data Collection: Use a single platform or API to avoid data silos.
- Automate Reporting: Set up dashboards that auto‑populate with key metrics each session.
- Educate Your Team: Offer short workshops on interpreting graphs and setting SMART goals based on the data.
Case Study Snapshot
A youth soccer academy implemented wearable GPS trackers. By analyzing sprint counts per drill, coaches adjusted conditioning circuits, reducing injury incidents by 15% over a season while increasing average sprint distance by 8%.
Key Takeaway
Wearable data moves coaching from intuition to precision. When thoughtfully integrated, it enhances training quality, speeds recovery, and empowers athletes with tangible evidence of their progress.
Personalized Training Adjustments
When you combine real‑time biometric signals from wearables with traditional coaching, you unlock a level of personalization that was impossible a decade ago. Below are concrete ways to translate data into actionable changes during a training session.
1. HRV‑Based Warm‑Ups
High HRV indicates good recovery; low HRV signals fatigue. A coach can program a wearable app to display a simple “warm‑up intensity” slider that adjusts based on the athlete’s nightly HRV reading.
- Low HRV (< 50 ms): Reduce warm‑up volume by 20 % and focus on mobility drills.
- High HRV (≥ 60 ms): Increase intensity, add dynamic stretches or short sprints.
This real‑time adjustment prevents over‑exertion early in the session and keeps athletes operating within their optimal training zone.
2. Power Curve Feedback for Resistance Training
Using a power meter or an inertial sensor on the barbell, you can map the athlete’s power output across rep ranges. The wearable app sends a live graph to the coach’s tablet.
- If power drops below 70 % of the first rep in the third set, suggest a technique tweak or a brief rest period.
- Consistent high power across sets indicates readiness for heavier loads; trigger an automatic increase of the next session’s weight by 5‑10 %
This approach tailors load progression to individual fatigue patterns rather than relying on generic formulas.
3. Real‑Time Pace & Cadence Matching
A wearable GPS watch paired with a cadence sensor can display an “ideal cadence” overlay on the route map.
- When the runner dips below 170 steps/min at a target pace, the coach receives a push notification to cue a faster stride.
- If the athlete is above the ideal cadence but slowing down, the system suggests a brief jog or walk break.
This immediate feedback helps maintain efficient biomechanics and prevents the onset of lactic acid buildup.
How to Seamlessly Merge Data With Your Coaching Style
- Set Up a Dashboard: Use platforms like Strava, TrainingPeaks, or custom BI tools to aggregate all wearable feeds into one screen.
- Create Thresholds: Define clear numeric thresholds for each metric (e.g., HRV, power drop‑off, cadence deviation) that trigger coaching actions.
- Practice “Data‑Driven Cueing”: During a dry run, rehearse how you’ll verbalize adjustments based on the numbers—this ensures cues feel natural during live sessions.
- Iterate and Record: Log every adjustment and its outcome. Over time, you’ll build a personalized “data‑response” library for each athlete.
By treating wearable data as an extension of your coaching intuition rather than a replacement, you can design training sessions that are both scientifically grounded and highly responsive to each athlete’s day‑to‑day state. The result? Faster progress, reduced injury risk, and a more engaging experience for everyone involved.
Monitoring Recovery and Preventing Injury
One of the most powerful advantages of wearable technology is its ability to give athletes a real‑time, data‑driven view of their physiological state. By monitoring key metrics such as heart rate variability (HRV), sleep quality, hydration levels, and even muscle activation patterns, coaches can tailor training loads, optimize recovery protocols, and reduce the risk of overuse injuries.
1. Tracking Heart Rate Variability (HRV)
- What it is: HRV measures the variation in time between successive heartbeats. Higher variability typically indicates better autonomic balance and recovery.
- Practical use: A daily HRV check can inform whether an athlete should push hard, maintain intensity, or take a lighter session.
- Example: If a runner’s HRV drops below their baseline for three consecutive days, the coach schedules a low‑intensity recovery run or cross‑training activity instead of a scheduled interval workout.
2. Sleep Quality Analytics
Wearables can log sleep stages (light, deep, REM) and total sleep time. Poor sleep correlates with impaired performance and higher injury risk.
- Assessing trends: A sudden increase in REM latency or a drop in deep sleep duration may signal stress or inadequate recovery.
- Intervention: Recommend sleep hygiene practices, adjust pre‑sleep caffeine intake, or reschedule late‑night training sessions.
3. Hydration and Electrolyte Monitoring
Some smart garments and wristbands can estimate sweat rate and electrolyte loss through skin conductance or temperature sensors.
- Application: If an athlete’s sweat rate exceeds a predetermined threshold, the system suggests increased fluid intake or electrolyte‑rich drinks during training.
- Outcome: Maintaining hydration reduces muscle cramping and improves neuromuscular performance.
4. Muscle Activation and Fatigue Indexes
EMG (electromyography) sensors embedded in compression sleeves can detect changes in muscle recruitment patterns, indicating fatigue or compensatory mechanics.
Case Study: A soccer player with a sudden rise in quadriceps activation during sprint drills was flagged for potential hamstring overload. The coaching staff introduced targeted eccentric strengthening and adjusted the player's sprint volume accordingly.
5. Implementing a Data‑Driven Recovery Protocol
- Baseline Establishment: Gather at least two weeks of data to set individual baselines for HRV, sleep, and activity.
- Alert System: Configure thresholds that trigger alerts (e.g., HRV drop >10% from baseline).
- Recovery Interventions: Pair alerts with actionable steps—stretching routines, foam‑rolling sessions, active recovery days, or scheduled rest.
- Review & Iterate: Hold weekly review meetings to discuss data trends and adjust training plans.
6. Injury Prevention Through Load Management
Wearable GPS units can track external load metrics such as total distance, high‑intensity running (HIR), and acceleration counts.
- Monitoring: Compare weekly external load to internal load indicators (e.g., perceived exertion).
- Adjustment Strategy: If an athlete’s external load spikes while internal load remains low, consider a progressive overload approach to avoid sudden stress.
7. Practical Tips for Coaches and Athletes
| Metric | What to Watch For | Actionable Step |
|---|---|---|
| HRV | Drop >10% from baseline for 2+ days | Reduce training intensity, add recovery modalities |
| Sleep Duration | Below 7 hrs/night consistently | Implement sleep hygiene protocol, adjust training times |
| Sweat Rate | Exceeds 1.5 L/h during sessions | Increase fluid intake, add electrolytes |
| Acceleration Count | Rapid increase week‑on‑week | Gradual load progression, monitor for pain |
By integrating these wearable data streams into daily training loops, athletes can gain a holistic view of their readiness, coaches can personalize interventions, and the overall risk of injury is substantially lowered. Consistency in data collection, clear communication of insights, and timely adjustments are key to turning raw numbers into tangible performance gains.
Real‑Time Feedback During Sessions
Wearable devices turn raw data into actionable insights that can be delivered instantly to athletes and coaches. By feeding real‑time metrics back into the training environment, practitioners can make split‑second adjustments that enhance performance, reduce injury risk, and keep motivation high.
Key Metrics for In‑Session Monitoring
- Heart Rate (HR) & HRV: Immediate gauge of exertion level; helps maintain training zones.
- Power Output: For cyclists and rowers, shows whether the athlete is staying on target or over‑exerting.
- Acceleration / Impact Forces: Detects sudden spikes that could precede injury.
- GPS & Cadence: Tracks pacing, distance covered, and changes in terrain difficulty.
- Respiratory Rate (RR): Indicates breathing efficiency and recovery status.
Practical Implementation Steps
- Select the right device: Match sensor capabilities to sport requirements—e.g., GPS watches for endurance sports, inertial measurement units (IMUs) for sprinting or gymnastics.
- Integrate with a live dashboard: Use platforms like Strava Live Segments, Zwift, or custom dashboards built on Grafana. Ensure low latency (<2 s) between sensor capture and display.
- Set thresholds & alerts: Configure real‑time notifications for HR above 85% of max, power dropping below a target wattage, or impact forces exceeding safe limits.
- Embed audio/visual cues: Use haptic vibrations or on‑screen popups to alert athletes without distracting them from the task.
- Record and analyze post‑session: Sync live data to cloud storage for deeper analysis (e.g., RPE correlation, fatigue modeling).
Real‑World Example: Sprint Training with IMUs
A sprint coach uses wearable IMUs on athletes’ shins. During a 60‑second interval:
- The system displays acceleration peaks in real time.
- If an athlete’s vertical impact exceeds 4 g, the coach receives a vibration alert and immediately corrects stride mechanics.
- Post‑interval, the coach reviews joint angle data to fine‑tune technique for next session.
Benefits of Real‑Time Feedback
- Immediate correction: Athletes adjust form on the spot, preventing bad habits from forming.
- Enhanced motivation: Seeing live progress keeps engagement high.
- Injury prevention: Early detection of abnormal loads allows for proactive rest or rehab interventions.
- Data‑driven coaching decisions: Coaches can shift training focus based on actual performance rather than estimates.
Troubleshooting Tips
- Ensure strong Bluetooth/Wi‑Fi signal; use repeaters if necessary.
- Regularly calibrate sensors—especially power meters and GPS units—to maintain accuracy.
- Verify time sync across devices to avoid data misalignment.
By embedding real‑time wearable data into training sessions, coaches transform passive workouts into interactive learning experiences that accelerate improvement while safeguarding athlete health.
Post‑Session Analysis for Performance Gains
Once the training session has ended, the real work begins: turning raw wearable data into actionable insights that can elevate your athlete’s next performance. Below is a step‑by‑step guide on how to conduct a thorough post‑session analysis, complete with examples and practical tips for both coaches and athletes.
1. Data Consolidation
- Collect all data streams: heart rate (HR), HRV, GPS speed & distance, power output (if using a watt meter), cadence, accelerometer readings, and subjective RPE.
- Use a single platform or spreadsheet template: Import the files into a tool like Strava, TrainingPeaks, or a custom Google Sheet to keep everything in one place.
2. Basic Metrics Overview
| Metric | Description |
|---|---|
| Total Distance | Sum of all GPS points (km or miles). |
| Ave. Speed | Average speed over the entire session. |
| HR Zones | Time spent in each heart‑rate zone. |
| Power (if available) | Average, peak, and training impulse (TRIMP). |
3. Advanced Analysis Techniques
Beyond the basics, you can dig deeper to uncover hidden patterns.
a) Heart‑Rate Variability (HRV) Trends
- Plot HRV vs. RPE: Higher HRV often correlates with lower perceived effort. Use a scatter plot to see if the athlete’s subjective feeling matches physiological data.
- Recovery index: Calculate the ratio of HRV before and after the session; a drop below 0.8 may indicate insufficient recovery.
b) Power‑Zone Distribution (Cyclists)
If you have power data, create a power histogram to see how much time was spent in each zone. A balanced distribution usually signals good conditioning, while heavy reliance on Zone 3 may suggest the athlete is overtaxed.
c) GPS Heat Maps
- Overlay speed or HR data onto a heat map to identify sections where the athlete slowed down or pushed hard.
- Use this to spot tactical errors (e.g., unnecessary surges) or physical limitations (e.g., fatigue in certain terrain).
4. Performance Benchmarks
Compare current session data against previous sessions or personal bests.
- Rolling averages: Compute a 7‑day rolling average for key metrics to smooth out day‑to‑day noise.
- Percent change: Calculate the percentage difference from baseline; a >5% improvement in speed or power is typically significant.
5. Actionable Takeaways
Translate data into concrete next steps:
- Training load adjustment: If HRV has dropped, reduce volume or intensity for the next week.
- Tactical tweaks: Use GPS heat maps to adjust pacing strategy in specific course segments.
- Recovery protocols: High heart‑rate peaks may warrant a dedicated cool‑down or active recovery session.
6. Reporting Format
Create a concise, visually engaging report that includes:
- A summary of key metrics (table or bar chart).
- Heat maps and power histograms.
- Bullet‑point action items for the athlete and coach.
- Links to raw data files for deeper inspection.
7. Practical Example: Road Cycling Session
Imagine a 90‑minute ride with the following highlights:
- Total Distance: 45 km
- Ave. Speed: 35 km/h
- HR Zones: 20 min in Zone 3, 10 min in Zone 4, 5 min in Zone 5
- Power Output: Avg. 250 W, Peak 350 W
- HRV Change: Pre‑ride HRV 55 ms, Post‑ride HRV 48 ms (−12%)
Analysis: The athlete spent most time in Zone 3, which is good for endurance. However, the drop in HRV suggests fatigue; recommend a recovery ride next day and a reduced volume for the following week.
8. Tips for Coaches & Athletes
- Consistency matters: Wearable data is only useful if collected regularly.
- Validate devices: Cross‑check HRV and power outputs against known standards to avoid misinterpretation.
- Keep it simple: Focus on 2–3 key metrics per session; overwhelm leads to paralysis.
- Integrate with training plans: Use insights to fine‑tune periodization cycles.
By following this structured approach, you’ll transform raw wearable data into a powerful tool for continuous performance improvement. Happy analyzing!
Data Privacy and Ethical Considerations
When integrating wearable technology into training sessions, the collection of biometric and performance data raises important privacy and ethical questions. Below are key points to consider, along with practical steps for safeguarding athlete information.
1. Informed Consent
- Clear communication: Explain what data will be collected (e.g., heart rate, GPS, sleep patterns), how it will be used, and who will have access.
- Opt‑in/opt‑out options: Provide athletes with the ability to consent to specific data streams or withdraw entirely without penalty.
2. Data Minimization
Collect only the metrics that directly support training objectives. For example, if the goal is to improve sprint speed, gather acceleration and stride frequency rather than full body kinematics unless needed for injury prevention.
3. Secure Storage & Transmission
- AES‑256 encryption: Use industry‑standard encryption for data at rest and in transit.
- Cloud compliance: Choose hosting providers that comply with GDPR, HIPAA (if medical data is involved), or other relevant regulations.
4. Anonymization & Aggregation
When sharing insights with coaches, teammates, or third‑party analytics platforms, anonymize personal identifiers and provide aggregated statistics to reduce re‑identification risk.
5. Data Retention Policies
- Retention schedule: Define how long raw data will be stored (e.g., 12 months) and automatically delete it afterward unless the athlete explicitly requests retention for research purposes.
- Version control: Keep a log of who accessed or modified the data, ensuring accountability.
6. Ethical Use of Data
Beyond legal compliance, consider the moral implications of using athlete data to make decisions that could affect careers.
- No punitive measures: Avoid penalizing athletes for natural performance dips unless they are due to misconduct.
- Transparency in analytics: Provide explanations of how algorithms reach conclusions (e.g., “this sprint time indicates fatigue based on your baseline.”).
7. Athlete Empowerment
Give athletes control tools such as dashboards where they can view, download, or delete their own data.
- Self‑reporting: Allow athletes to flag anomalies (e.g., a sudden spike in heart rate) that may be clinically relevant.
- Education: Offer short tutorials on interpreting key metrics and understanding privacy settings.
8. Third‑Party Integrations
When sharing data with external services (e.g., cloud analytics, wearable vendors), ensure they adhere to the same privacy standards.
- Data processing agreements: Draft contracts that specify data handling responsibilities and breach notification procedures.
- API security: Use OAuth 2.0 or similar authentication protocols for secure data exchange.
9. Continuous Monitoring & Auditing
Implement regular audits to detect unauthorized access, data leaks, or misuse of athlete information.
- Penetration testing: Conduct bi‑annual security assessments.
- Audit trails: Log every read/write operation on sensitive datasets.
10. Legal Compliance Checklist
Use this quick reference to ensure your program meets regional and international privacy laws:
| Regulation | Key Requirement |
|---|---|
| GDPR (EU) | Explicit consent, right to erasure, data portability. |
| COPPA (USA) | Parental consent for minors under 13. |
| HIPAA (USA) | Protection of medical information if applicable. |
| CCPA (California) | Consumer opt‑out, data disclosure rights. |
By following these guidelines, you can harness the power of wearable data to elevate training outcomes while maintaining trust and protecting athlete privacy.
Challenges in Data Interpretation
While wearable devices can generate a wealth of information, turning raw numbers into actionable insights is far from straightforward. Below are the most common hurdles and practical ways to overcome them.
1. Data Saturation & Information Overload
- Problem: Sensors record heart rate, GPS speed, cadence, power output, skin temperature, etc., every second. Coaches may feel overwhelmed by the sheer volume.
- Practical Advice:
- Select a core set of metrics that align with training goals (e.g., HRV for recovery, VO₂ max estimates for endurance).
- Use dashboards that automatically flag outliers or trends rather than displaying every data point.
- Set weekly review intervals—once per week instead of daily—to focus on patterns rather than noise.
2. Lack of Contextual Understanding
- Problem: A spike in heart rate could mean intense effort, a hot day, or even illness.
- Practical Advice:
- Combine physiological data with environmental logs (temperature, humidity) and subjective ratings (RPE, mood).
- Use multi‑modal visualization tools that overlay HRV curves on weather maps or training logs.
- Educate athletes to annotate sessions immediately after they happen—small notes can clarify later analysis.
3. Sensor Accuracy & Calibration Issues
- Problem: Consumer wearables can drift or misread in certain conditions (e.g., high-intensity sprinting).
- Practical Advice:
- Regularly calibrate devices against gold‑standard instruments when possible.
- Validate key metrics by cross-referencing with lab tests or other validated wearables.
- Set tolerance thresholds—e.g., ignore HR readings that jump >30 bpm within 2 seconds unless corroborated by power data.
4. Statistical Literacy Gap
- Problem: Coaches may lack the expertise to interpret regression outputs, confidence intervals, or significance tests.
- Practical Advice:
- Use user‑friendly analytics platforms that translate statistics into plain language (e.g., “Your VO₂ max improved by 3% – statistically significant”).
- Offer short workshops or webinars on basic data science concepts relevant to sports performance.
- Collaborate with a sports scientist or data analyst for complex projects like periodization modeling.
5. Privacy & Ethical Use of Data
- Problem: Collecting continuous biometric data raises concerns about consent, data ownership, and potential misuse.
- Practical Advice:
- Obtain explicit informed consent before collecting or sharing any personal data.
- Implement role‑based access controls—only authorized staff can view sensitive metrics.
- Adopt anonymization techniques for aggregated reports shared with external stakeholders.
By systematically addressing these challenges, teams can transform raw wearable data into reliable, actionable insights that genuinely enhance training quality and athlete performance.
Future Trends in Wearable Technology
In the next few years, wearable technology will evolve from simple activity trackers to sophisticated, AI‑driven coaching tools that deliver actionable insights in real time. By integrating biometric data with advanced analytics, coaches and athletes can fine‑tune every aspect of training—from pacing and intensity to recovery and injury prevention.
1. Real‑Time Performance Monitoring
- Heart Rate Variability (HRV) Alerts: Wearables now calculate HRV during sleep and wakefulness, providing an instant health score that can dictate whether a session should be high intensity or light recovery.
- Power‑to‑Weight Ratio Tracking: For cyclists and runners, power meters coupled with GPS allow coaches to see exactly how much effort is being spent relative to body mass, helping to identify inefficiencies.
2. Personalized Intensity Zones
Traditional training zones (e.g., Zone 2 aerobic, Zone 4 anaerobic) are often based on generic percentages of max heart rate or VO₂max. Wearable data can refine these zones by incorporating daily readiness scores and lactate threshold estimations derived from continuous metrics.
3. Load Management & Injury Prevention
- Total Daily Energy Expenditure (TDEE) vs. Session Load: By comparing calories burned during a session with the overall daily energy budget, coaches can avoid over‑training.
- Biomechanical Feedback: Sensors on joints and limbs provide joint angle data; deviations from optimal ranges trigger alerts for corrective drills.
4. Adaptive Training Plans
Machine learning models ingest wearable data (HR, GPS, sleep quality) to predict fatigue levels and suggest dynamic adjustments—such as a lighter workout on Day 2 after an intense session or a strategic rest day when sleep scores dip below 70%.
5. Gamification & Motivation
- Real‑Time Leaderboards: Competitions based on objective metrics (e.g., fastest 5 km in the last week) keep athletes engaged.
- Micro‑Goal Rewards: Achieving a daily step target or maintaining a heart rate within Zone 3 earns badges that can be shared on social media, reinforcing consistency.
Practical Implementation Checklist
- Select the Right Device: Ensure it supports continuous HR, GPS, and accelerometer data; compatibility with your coaching platform is essential.
- Integrate Data Streams: Use APIs (e.g., Strava, Garmin Connect) to pull data into a central dashboard where coaches can view trends.
- Define Thresholds: Collaboratively set HRV, power, and sleep thresholds with athletes; adjust based on performance feedback.
- Schedule Regular Reviews: Weekly analytics meetings help interpret patterns—e.g., a sudden drop in HRV may indicate the need for an active recovery day.
- Educate Athletes: Provide short tutorials on interpreting their data; knowledge empowers them to self‑adjust within safe limits.
Case Study: Elite Marathon Training
An elite runner used a smartwatch that logged HR, VO₂max estimates, and sleep stages. The coaching team noticed an unexpected dip in sleep efficiency during the first week of a back‑to‑back long run block. They reduced training volume by 15% for two days and introduced foam‑rolling sessions. Within a week, the runner’s HRV recovered to baseline, and subsequent race performance improved by 2 %. This example illustrates how data‑driven tweaks can prevent burnout without compromising competitive edge.
Future Outlook
- Edge AI: On-device processing will allow instantaneous feedback, eliminating lag between data capture and actionable insights.
- Biometric Integration: Continuous glucose monitoring and blood oxygen saturation will add layers of health context to training decisions.
- Holistic Wellness Platforms: Wearables will merge with mental‑health apps, offering a 360° view of an athlete’s readiness.
By harnessing wearable data thoughtfully, coaches can transform training from a trial‑and‑error process into a precision science—maximizing performance while safeguarding long‑term health.
Case Studies: Success Stories
Below are real‑world examples of how wearable technology has transformed training programs across a variety of settings—from elite sports teams to corporate wellness initiatives. Each case highlights the specific data collected, the insights gained, and the tangible improvements in performance or health outcomes.
1. Elite Football Club – Optimizing Match Fitness
- Wearables Used: GPS vests with heart‑rate monitors (Catapult, Polar)
- Key Metrics: Total distance, high‑speed runs (>19 km/h), accelerations/decelerations, session rating of perceived exertion (sRPE)
- Challenge: Players were experiencing inconsistent recovery times, leading to a spike in injury rates during congested fixtures.
- Insight: Data revealed that players exceeding 200 high‑speed runs per match had a 35% higher risk of hamstring strain. Recovery sessions were not aligned with individual load thresholds.
- Action Taken: Implemented personalized load limits (e.g., max 180 high‑speed runs for certain positions) and introduced dynamic recovery protocols based on real‑time heart‑rate variability.
- Outcome: Injury incidence dropped by 22% over the season, while match performance metrics (average sprint speed, successful tackles) improved by 4–6%.
2. Corporate Wellness Program – Boosting Employee Productivity
- Wearables Used: Smartwatches (Apple Watch Series 9, Fitbit Charge)
- Key Metrics: Sleep quality scores, daily step counts, heart‑rate variability (HRV), stress alerts.
- Challenge: Mid‑level managers reported chronic fatigue and decreased focus during peak work periods.
- Insight: HRV data indicated poor autonomic balance during late afternoons. Sleep quality scores were consistently below the 70% threshold for restorative sleep.
- Action Taken: Introduced a “micro‑break” protocol: every 90 minutes, employees receive an app prompt to stand, stretch, and perform breathing exercises. A weekly virtual coaching session addresses sleep hygiene.
- Outcome: Average daily steps rose by 18%, HRV improved by 12% (indicating better recovery), and self‑reported productivity scores increased from 3.2/5 to 4.1/5 within three months.
3. Youth Soccer Academy – Enhancing Skill Development
- Wearables Used: Accelerometer‑based wristbands (Stryd, Zephyr)
- Key Metrics: Acceleration bursts, deceleration patterns, ball impact force.
- Challenge: Coaches struggled to quantify technical progress in small‑group drills.
- Insight: Data showed that players who performed >10 high‑intensity acceleration bursts during a drill maintained better positional awareness on the field.
- Action Taken: Structured drills to target specific movement profiles, with real‑time feedback via a tablet dashboard. Coaches could see which players met their individual acceleration targets.
- Outcome: Technical skill assessments improved by 15% over the season; player engagement scores increased as athletes saw measurable progress.
4. Cross‑Fit Gym – Reducing Overtraining Risk
- Wearables Used: Chest strap HR monitors (Garmin, Wahoo)
- Key Metrics: Average heart rate during workouts, training load index (TL), recovery index.
- Challenge: Members frequently reported “burnout” after intensive monthly competitions.
- Insight: A subset of athletes consistently exceeded a TL > 80 for more than three consecutive weeks, correlating with decreased performance in subsequent sessions.
- Action Taken: Implemented a “smart taper” schedule where training load is automatically reduced when the recovery index falls below 70%. The app sends personalized reminders to adjust intensity.
- Outcome: Competition readiness improved; members reported a 30% reduction in perceived fatigue and maintained higher performance scores across three months.
Practical Takeaways for Your Training Program
- Select the Right Sensors: Match your wearable’s capabilities (GPS, HRV, accelerometers) to the specific goals of your program.
- Define Clear Load Thresholds: Use baseline data to set individualized limits for high‑intensity work and recovery periods.
- Integrate Real‑Time Dashboards: Coaches and participants should have instant access to key metrics, enabling on‑the‑spot adjustments.
- Link Data to Feedback Loops: Translate raw numbers into actionable advice (e.g., “Increase step count by 10%” or “Take a 5‑minute stretch break”).
- Track Longitudinal Trends: Store historical data to monitor progress, adjust training cycles, and preempt injury risks.
By harnessing the power of wearable data, these organizations were able to move from intuition‑based coaching to evidence‑driven practice—resulting in measurable gains in performance, health, and overall satisfaction. Your next step? Start collecting data, identify actionable insights, and integrate them into your training workflow.
Conclusion
The integration of wearable technology into coaching workflows is no longer a futuristic idea—it's happening right now in gyms, sports academies, and even corporate wellness programs. By capturing granular, real‑time metrics, wearables give coaches the data they need to fine‑tune every aspect of a training session.
1. Personalizing Workouts with Real‑Time Feedback
- Heart Rate Variability (HRV): A wearable can flag when an athlete’s HRV dips below their baseline, signalling fatigue or insufficient recovery. Coaches can immediately adjust intensity—switching from a high‑intensity interval to a low‑impact mobility drill.
- Movement Sensors: Accelerometers and gyroscopes detect technique deviations (e.g., improper squat depth). The coach receives instant visual alerts on a tablet, allowing corrective feedback before the athlete ingrains bad habits.
2. Tracking Progress Over Time
Data dashboards compile weekly trends: average power output during cycling sessions, sprint times in track training, or even sleep duration from smartwatches. Coaches can use these charts to set evidence‑based goals and celebrate incremental gains.
3. Enhancing Group Dynamics
- Group Metrics Dashboards: A coach can view the collective heart rate zones of a running group in real time, ensuring that everyone stays within the target zone and preventing over‑training.
- Gamification Features: Wearables often sync with apps that allow athletes to earn badges for reaching step counts or staying within tempo. This adds motivation during team drills.
4. Injury Prevention & Load Management
By monitoring load metrics such as session rating of perceived exertion (sRPE) and cumulative training load, wearables flag spikes that precede injury risk. Coaches can pre‑emptively schedule lighter sessions or targeted mobility work.
5. Practical Implementation Tips
- Choose the Right Device: Match sensor accuracy to sport demands (e.g., GPS watches for distance, chest straps for HR).
- Integrate with Coaching Software: Platforms like TrainingPeaks or Strava allow data aggregation and automated reporting.
- Educate Athletes: Explain the purpose of each metric so they understand why a coach might change a workout on the spot.
- Set Data‑Driven Benchmarks: Establish baseline metrics at the start of a season and revisit them every 4–6 weeks.
- Maintain Privacy & Consent: Ensure athletes consent to data collection and understand how it will be used.
In short, wearable data transforms training from an art into a science. By leveraging real‑time insights, coaches can create safer, more effective sessions that adapt to each athlete’s evolving needs—ultimately accelerating performance gains while minimizing injury risk.
FAQ
1. What types of wearable devices are most useful for coaching?
The most common wearables that provide actionable data for coaches include:
- GPS watches & smartwatches: Track distance, pace, elevation, and route.
- Heart‑rate monitors (chest straps or wrist‑based): Provide real‑time heart‑rate zones and recovery metrics.
- Power meters: Offer precise power output for cycling, rowing, and even running (via foot pods).
- Accelerometers & gyroscopes: Measure movement quality, cadence, and symmetry.
2. How can I use GPS data to structure a training plan?
GPS metrics such as total distance, average speed, and elevation gain give you a clear picture of session volume and intensity:
- Baseline assessment: Record a 10‑km run or 40‑min bike ride to establish current fitness.
- Progressive overload: Increase weekly mileage by 5–10% while monitoring average pace and elevation.
- Specific workouts: Design interval sessions based on target speed zones (e.g., 4 × 1 km at 90 % of maximum pace).
Example: A runner starts with a 5‑km baseline. By week four, GPS data shows an average pace improvement from 6:30/km to 6:10/km, indicating the body is adapting and ready for harder intervals.
3. In what ways does heart‑rate monitoring enhance recovery strategies?
Heart‑rate data offers real‑time feedback on effort and helps prevent overtraining:
- Zone training: Keep workouts within designated HR zones (e.g., Zone 2 for aerobic base).
- Recovery heart rate: A lower resting HR after a session suggests adequate recovery.
- Post‑exercise heart‑rate variability (HRV): High HRV indicates better autonomic balance and readiness.
Practical tip: Use an app that syncs with your wearable to generate a daily “Recovery Score.” If the score dips below 70%, consider a light jog or active stretch instead of another hard session.
4. How can power meters change the way I coach cyclists?
Power data removes subjectivity from training:
- Consistent effort measurement: Power is not affected by wind or terrain, so you can compare sessions accurately.
- Threshold identification: Use functional threshold power (FTP) tests to set realistic training zones.
- Real‑time adjustments: If a rider’s power drops below target during a climb, you can immediately suggest pacing changes.
Example: A cyclist trains 3×10 min intervals at 95% FTP. After a week of data collection, the coach sees that average power is only 88%—the rider may need to work on climbing efficiency or gear selection.
5. What are best practices for integrating wearable data into coaching software?
- Choose a platform that supports multiple data streams: Look for integrations with Strava, TrainingPeaks, or Garmin Connect.
- Automate data import: Set up API connections so workouts populate automatically.
- Create dashboards: Visualize key metrics (pace, HR, power) in a single view for quick decision‑making.
- Set alerts: Configure notifications when a rider’s metrics fall outside desired ranges.
6. How can I ensure data privacy and compliance?
Follow these steps to protect athlete information:
- Obtain explicit consent: Have athletes sign a data‑usage agreement.
- Use secure storage: Store data on encrypted cloud services with two‑factor authentication.
- Limit access: Only authorized staff should view sensitive metrics.
7. What are some real‑world success stories?
A high‑school cross‑country team used GPS and HR data to tailor weekly mileage. Over a season, their average 5k time improved from 18:30 to 17:45—a 2 % performance gain.
Another example: A triathlon club implemented power meters for all cyclists and saw a 15 % reduction in time spent in the “red” (over‑exertion) zone, translating into fewer injuries and better race results.
8. What are common pitfalls to avoid?
- Over‑reliance on a single metric: Combine GPS, HR, and power for a holistic view.
- Data overload: Focus on actionable KPIs rather than every raw number.
- Ignoring athlete feedback: Wearable data should complement, not replace, the athlete’s subjective experience.
By leveraging wearable technology thoughtfully, coaches can create more precise, personalized, and effective training programs that drive measurable performance gains while safeguarding athlete health.
Categories
- AI & Enrichment Play
- Broiler Farming
- Broiler Farming Tips
- Canine Wellness & Longevity
- Cat
- Cat & Human Connection
- Cat Adoption & Rescue
- Cat Breeds
- Cat Breeds & Personalities
- Cat Care & Health
- Cat Grooming & Hygiene
- Cat Lifestyle & Environment
- Cat Myths & History
- Cat Nutrition & Diet
- Cat Products & Reviews
- Cat Training & Behavior
- Comparison
- Consumer Awareness
- Dog
- Dog Accessories & Products
- Dog Adoption & Rescue
- Dog Breed & Lifestyle Trends
- Dog Breeding & Puppies
- Dog Entertainment & Media
- Dog Fashion & Trends
- Dog Fun & Lifestyle
- Dog Grooming & Hygiene
- Dog History & Culture
- Dog Myths, Science & Future Tech
- Dog News & Trends
- Dog Nutrition & Food
- Dog Psychology & Emotions
- Dog Safety & Security
- Dog Sports & Activities
- Dog Technology & Innovation
- Dog Training for Modern Owners
- Dog Travel & Adventure
- Dog Travel, Adventure & Culture
- Economic and Market Insights
- Educational Content
- FAQs
- Feeding Alternatives
- Festivals & Seasonal Ideas
- Fun & Entertainment
- General Knowledge
- General Pig Farming
- Health & Disease Management
- Housing and Environment
- Kittens
- Market Insights
- Miscellaneous
- Miscellaneous
- Motivational
- pig
- Pig Breeding
- Pig Breeds
- Pig Farming Stories and Inspiration
- Pig Health and Care
- Pig Nutrition
- Pig Products
- Profitability & Business
- Puppy Care
- Puppy Predictable Topics Reinvented
- Regional Focus
- Rescue & Adoption Buzz
- Senior Cats
- Senior Dog Care
- Smart Dog Tech & Gadgets
- Sustainability
- Sustainable & Eco-Friendly Dog Products
- Tech & Innovations
- Working & Service Dogs
- Broiler Feed66 products
- Country Feed33 products
- Pig Feed66 products
- Product22 products
- Raw Materials99 products
Products
-
 Fish Meal
₹1,999.00 – ₹2,999.00Price range: ₹1,999.00 through ₹2,999.00Rated 0 out of 5
Fish Meal
₹1,999.00 – ₹2,999.00Price range: ₹1,999.00 through ₹2,999.00Rated 0 out of 5 -
 FATTENING BROILER FEED
₹2,299.00 – ₹2,349.00Price range: ₹2,299.00 through ₹2,349.00Rated 0 out of 5
FATTENING BROILER FEED
₹2,299.00 – ₹2,349.00Price range: ₹2,299.00 through ₹2,349.00Rated 0 out of 5 -
 LAYER COUNTRY FEED
₹1,549.00 – ₹1,649.00Price range: ₹1,549.00 through ₹1,649.00Rated 0 out of 5
LAYER COUNTRY FEED
₹1,549.00 – ₹1,649.00Price range: ₹1,549.00 through ₹1,649.00Rated 0 out of 5 -
 COUNTER BROILER FEED
₹1,199.00 – ₹1,299.00Price range: ₹1,199.00 through ₹1,299.00Rated 0 out of 5
COUNTER BROILER FEED
₹1,199.00 – ₹1,299.00Price range: ₹1,199.00 through ₹1,299.00Rated 0 out of 5 -
 LACTATING PIG FEED
Rated 0 out of 5
LACTATING PIG FEED
Rated 0 out of 5₹2,299.00Original price was: ₹2,299.00.₹1,740.00Current price is: ₹1,740.00. -
 Maize
Rated 0 out of 5
Maize
Rated 0 out of 5₹1,650.00Original price was: ₹1,650.00.₹1,300.00Current price is: ₹1,300.00. -
 GESTATION PIG FEED (Phase 1)
Rated 0 out of 5
GESTATION PIG FEED (Phase 1)
Rated 0 out of 5₹2,249.00Original price was: ₹2,249.00.₹1,699.00Current price is: ₹1,699.00. -
 Pre Starter Broiler Feed
₹2,399.00 – ₹2,499.00Price range: ₹2,399.00 through ₹2,499.00Rated 0 out of 5
Pre Starter Broiler Feed
₹2,399.00 – ₹2,499.00Price range: ₹2,399.00 through ₹2,499.00Rated 0 out of 5 -
 FINISHER PIG FEED
Rated 0 out of 5
FINISHER PIG FEED
Rated 0 out of 5₹2,299.00Original price was: ₹2,299.00.₹1,749.00Current price is: ₹1,749.00. -
 Broiler Premix
Rated 0 out of 5
Broiler Premix
Rated 0 out of 5₹820.00Original price was: ₹820.00.₹699.00Current price is: ₹699.00.